
Your Report Awaits
Please use this link at any time to access the report “Benchmark Report – High Frequency Data Benchmarking”.
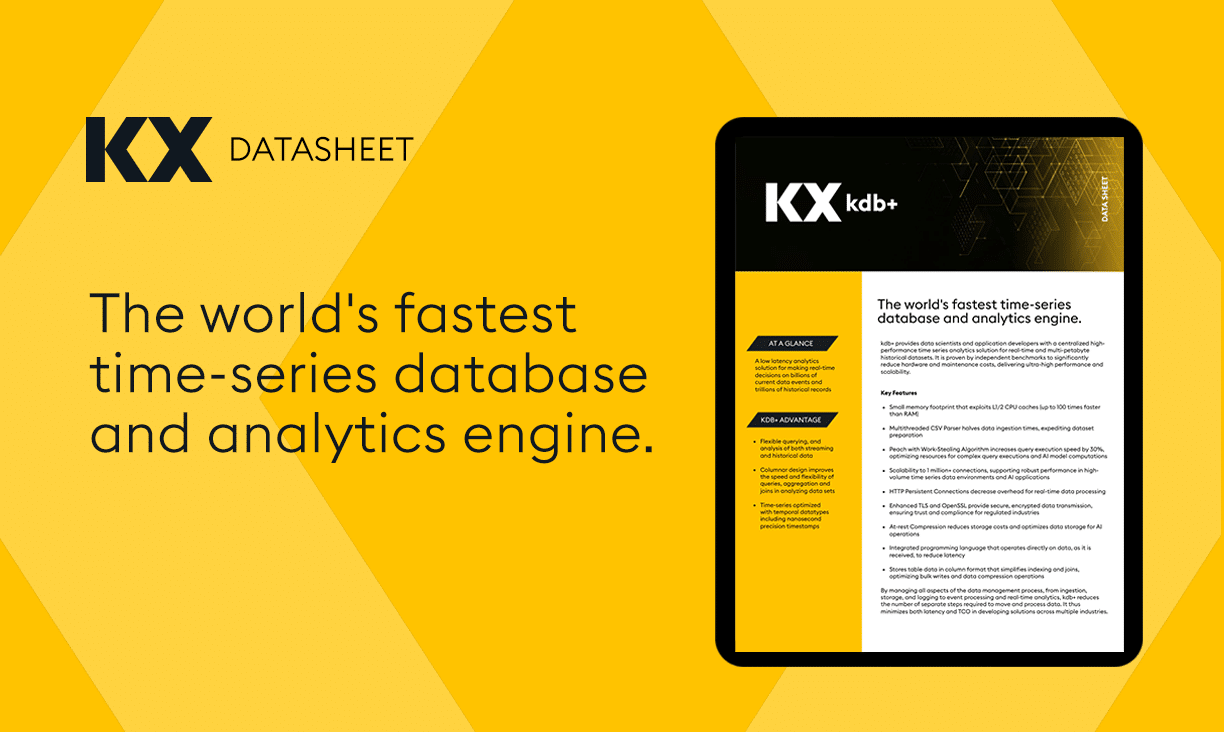
Demo the world’s fastest database for vector, time series and real-time analytics
Discover the secrets of the high-stakes world of capital markets, where trillions of events are processed daily, there’s no room for delay in our latest eBook.
Discover the future of data management in Wall Street with our new eBook and dive into the evolution of streaming analytics, time-series data management, and generative AI.

Our new whitepaper identifies the escalation of AI demands and the new challenges they bring to boards, technology providers, and consumers.

KX has announced the general availability of KDB.AI Server, a highly-performant, scalable, vector database for time-orientated generative AI and contextual search.
Products
kdb+
kdb Insights
KDB.AI
Delta
Sensors
Market Partners
Cloud Service
Data Lake
Market Data
Services & Support
About Us
Partner with Us
KX Partner Network
Find a Partner
Partner Signup
Join Us
Connect with Us
Please use this link at any time to access the report “Benchmark Report – High Frequency Data Benchmarking”.
Demo the world’s fastest database for vector, time series and real-time analytics
As they travelled to their first investigation, Dr Watson remarked to Sherlock Holmes that he didn’t seem to be giving the case his immediate attention:
“No data yet,” Holmes replied. “It is a capital mistake to theorize before you have all the evidence. It biases the judgment.”
That was in 1887. Imagine what Holmes could achieve today with data available from sources like criminal databases, social media and CCTV, advanced analytics, and visualization tools for deriving actionable insights and making informed decisions. Consider, for example, the benefits for predictive policing in identifying potential crime hotspot, high-risk periods, and allowing for pre-emptive measures. And it’s not just crime prediction and prevention where data can help. Among others are:
All are premised on efficient data management and analytics across the vast and varied data types in policing operations. But those requirements bring equally big and varying challenges. Some of the difficulties include:
KX has the proven technology to meet these needs. It provides data management and analytics solutions in industries ranging from finance and manufacturing to telecommunications, automotive, and pharmaceutical to empower their digital transformation with faster, more informed, data-driven insights. Moreover, businesses have realized it using standard hardware with outcomes, including achieving 100x performance at a tenth of the cost. Sample applications include:
Imagine what Holmes could achieve today with data available from sources like criminal databases, social media, CCTV, advanced analytics, and visualization tools.
At a non-functional level, the technology offers the high-performance, high availability, resilience, and security needs demanded of mission-critical applications in highly regulated environments. Those combined capabilities align closely with the needs of law enforcement agencies across a range of areas.
Across communication channels KX enables network analysis to map out social networks and relationships, geospatial analysis for tracking movements, sentiment analysis using NLP, real-time monitoring and alerts, machine learning for predictive analysis, integration with other data sources, encrypted and anonymized data analysis, legal and ethical compliance, and customizable dashboards for law enforcement.
For intelligence data, the capabilities are similarly impactful. It becomes possible to integrate and analyze data from multiple intelligence sources, providing real-time intelligence analysis, pattern recognition and anomaly detection, network analysis, predictive policing through machine learning, sentiment analysis, geospatial analysis, custom alerts and notifications, compliance with legal standards, and user-friendly dashboards and reporting tools.
Functionality that enables these insights include:
Collectively, these tools represent a transformative advancement in law enforcement technology, offering unparalleled capabilities in data analytics and predictive policing, contributing to more effective law enforcement, better resource allocation, and, ultimately, improved crime prevention and public safety measures.
If only Sherlock had those tools, he might have been more productive in that handsome ride with Watson!
Please contact us or demo kdb to learn more about how KX technology enables law enforcement with data.
With the announcement of kdb+ 4.1, we’ve made significant updates in performance, security, and usability, empowering developers to turbo charge workloads, fortify transmissions and improve storage efficiency. In this blog, we’ll explore these new features and demonstrate how they compare to previous versions.
Let’s begin.
“Peach” is an important keyword in kdb+, derived from the combination of “parallel” and “each”. It enables the parallel execution of a function on multiple arguments.
In kdb+ 4.1 the ability to nest “peach” statements now exists. Additionally, it no longer prevents the use of multithreaded primitives within the “peach” operation.
It also introduces a work-stealing algorithm technique in which idle processors can intelligently acquire tasks from busy ones. This marks a departure from the previous method of pre-allocating chunks to each thread, and with it, better utilization of CPU cores, which in our own test have resulted in significant reductions in processing time.
q)\s
8i

/Before: kdb+ 4.0
q)\t (inv peach)peach 2 4 1000 1000#8000000?1.
4406

/After: kdb+ 4.1
q)\t (inv peach)peach 2 4 1000 1000#8000000?1.
2035
For large enterprise deployments and cloud enabled workloads, unlimited network connections offer reliability and robust performance at an unprecedented scale. With kdb+ 4.1, user-defined shared libraries now extend well beyond 1024 file descriptors for event callbacks, and HTTP Persistent Connections elevate efficiency and responsiveness of data interactions, replacing the one-and-done approach previously used to reduce latency and optimize resource utilization.
The CSV load, fixed-width load (0:), and binary load (1:) functionalities are now multithreaded, signifying a significant leap in performance and efficiency, this is particularly beneficial for handling large datasets which in our own tests have resulted in a 50% reduction in ingestion times.
Socket operations have also been enhanced, resulting in a five-fold increase in throughput when tested against previous versions. With kdb+ 4.1 users can expect a significant boost in overall performance and a tangible difference, when dealing with high volume connections.
q)h:hopen `:tcps://localhost:9999
q)h ".z.w"
1004i

/Before: kdb+ 4.0
q)\ts:10000 h "2+2"
1508 512

/After: kdb+ 4.1
q)\ts:10000 h "2+2"
285 512
Enhanced TLS and Updated OpenSSL Support guarantee compliance and safeguard sensitive real-time data exchanges. With kdb 4.1 OpenSSL 1.0, 1.1.x, and 3.x, coupled with dynamic searching for OpenSSL libraries and TCP and UDS encryption, offers a robust solution for industries where data integrity and confidentiality are non-negotiable.
Furthermore, TLS messaging can now be utilized on threads other than the main thread. This allows for secure Inter-Process Communication (IPC) and HTTP operations in multithreaded input queue mode. Additionally, HTTP client requests and one-shot sync messages within secondary threads are facilitated through “peach”.
With the incorporation of advanced compression algorithms, kdb+ 4.1 ensures maximized storage efficiency without compromising data access speed. This provides a strategic advantage when handling extensive datasets.
Kdb+ 4.1 introduces several improvements to the q language that will help to streamline your code.
q)enlist[`aaa]!enlist 123 / 4.0
aaa| 123
With
q)([aaa:123]) / 4.1
aaa| 123
This syntax follows rules consistent with list and table literal syntax.
q)([0;1;2]) / implicit key names assigned when none defined
x | 0
x1| 1
x2| 2

q)d:([a:101;b:]);d 102 / missing values create projections
a| 101
b| 102

q)d each`AA`BB`CC
a b
------
101 AA
101 BB
101 CC
/Traditional Method
q)a:1 / atom

/Using new method to assign b as 2 and c as 3
q)(b;c):(2;3) / list

/Pattern matching on dictionary keys
q)([four:d]):`one`two`three`four`five!1 2 3 4 5 / dictionary

/Assigning e to be the third column x2
q)([]x2:e):([]1 2;3 4;5 6) / table

q)a,b,c,d,e
1 2 3 4 5 6
Before assigning any variables, q will ensure left and right values match.
q)(1b;;x):(1b;`anything;1 2 3) / empty patterns match anything
q)x

1 2 3
Failure to match will throw an error without assigning.
q)(1b;y):(0b;3 2 1)
'match

q)y
'y
/Checks if surname is a symbol
q)(surname:`s):`simpson

/Checks if age is a short
q)(name:`s;age:`h):(`homer;38h)

/Type error triggered as float <> short
q)(name:`s;age:`h):(`marge;36.5) / d'oh
'type

q)name,surname / woohoo!
`homer`simpson
And check function parameters too.
q)fluxCapacitor:{[(src:`j;dst:`j);speed:`f]$[speed<88;src;dst]}

q)fluxCapacitor[1955 1985]87.9
1955

q)fluxCapacitor[1955 1985]88
'type

q)fluxCapacitor[1955 1985]88.1 / Great Scott!
1985
We can extend this basic type checking to define our own ‘filter functions’ to run before assignment.
/ return the value (once we're happy)

q)tempCheck:{$[x<0;' "too cold";x>40;'"too hot" ;x]}
q)c2f:{[x:tempCheck]32+1.8*x}
q)c2f -4.5
'too cold

q)c2f 42.8
'too hot

q)c2f 20 / just right
68f
We can use filter functions to change the values that we’re assigning.
q)(a;b:10+;c:100+):1 2 3
q)a,b,c
1 12 103
Amend values at depth without assignment.
q)addv:{([v:(;:x+;:(x*10)+)]):y}
q)addv[10;([k:`hello;v:1 2 3])]
k| `hello
v| 1 12 103
Or even change the types.
q)chkVals:{$[any null x:"J"$ "," vs x;'`badData;x]}
q)sumVals:{[x:chkVals]sum x}
q)sumVals "1,1,2,3,5,8"
20

q)sumVals "8,4,2,1,0.5"
'badData
We hope you are as excited as we are about the possibilities these enhancements bring to your development toolkit. From parallel processing and network scalability to streamlined data loading, secure transmissions, and optimized storage, our commitment is to empower you with tools that make your coding life more efficient and enjoyable.
We invite you to dive in, explore, and unlock the full potential of kdb+ 4.1. Download our free Personal Edition today.
Happy coding!
In financial services, transformation is constant. So, reflecting on the lyrics of Tears for Fears’ 1985 global hit “Everybody Wants to Rule the World,” I find myself drawing parallels to the shifting power dynamics in financial technology. My favorite teenage song subtly echoes a truth relevant to today’s financial industry: the quest for progress hinges not just on desire but on access to tools and opportunities too often limited to the elite.
Undoubtedly, Tears for Fears weren’t singing about being resentful of the tier 1 and tech hedge fund dominance of the 1990s to 2010s. Luckily, for FinTech, at least, times have changed, and much tooling, once only available to tier 1 organizations, is now available to the masses, with out-of-reach quant skills ubiquitously distributed across the industry.
kdb, for one, is no longer exclusive. Cloud marketplaces and a Python-first mentality have lowered kdb costs of ownership significantly, helping make what was once exclusive available to all financial tiers and offices. That includes back and middle office, buyside, regulator, insurer, and sell-side, bringing the speed and efficiency-busting kdb data management and analytics to all. Benefits include:
That means all organizations can now trade, manage risk, analyse portfolios faster and more efficiently, and bring 10 to 100x more data to quantitative research, AI, and data science workflows.
In the last fifteen years, the commodifying effects of cloud and open-source technologies have transformed computational finance. Four key trends have predominated:
Let’s explore.
KX with kdb transforms the following use cases:
The toughest Tier 1 environments have proven the hardest analytics data management and analytics use cases. How can you enjoy the opportunities brought by differentiating tooling without the Tier 1 price tag or resource requirement?
With KX, then, “Everybody CAN Rule the World,” at least in Financial Services with a working computer and access to financial data and github.
Read our new ebook, 11 Insights to Help Quants Break Through Data and Analytics Barriers to accelerate your analytics journey.
Artificial Intelligence (AI) is transforming every industry and sector, from healthcare to finance, from manufacturing to retail. However, not all AI solutions are created equal. Many of them suffer from limitations such as poor scalability, low accuracy, high latency, and lack of explainability.
That’s why we’re excited to announce the integration of KDB.AI and LangChain, two cutting-edge technologies designed to overcome these challenges and deliver unparalleled capabilities for enterprise AI via a simple and intuitive architecture that doesn’t require complex infrastructure or costly expertise.
In this blog post, I’ll give you a brief overview of each technology, discuss typical use cases, and then show you how to get started. Let’s begin.
KDB.AI is an enterprise grade vector database and analytics platform that enables real-time processing of both structured and unstructured time-oriented data. It’s based on kdb+, the world’s fastest time-series database, which is widely used by leading financial institutions for high-frequency trading and market data analysis.
With KDB.AI, developers can seamlessly scale from billions to trillions of vectors without performance degradation, thanks to its distributed architecture and efficient compression algorithms. It also supports various data formats, such as text, images, audio, video, and more.
With KDB.AI you can:
To learn more about KDB.AI, visit our documentation site.
LangChain is an open-source framework designed to simplify the creation of applications powered by language models. At its core, LangChain enables you to “chain” together components, acting as the building blocks for natural language applications such as Chatbots, Virtual Agents and document summarization.
LangChain doesn’t rely on traditional NLP pipelines, such as tokenization, lemmatization, or dependency parsing, instead, it uses vector representations of natural language, such as word embeddings, sentence embeddings, or document embeddings, which capture the semantic and syntactic information of natural language in a compact and universal way.
To learn more about LangChain, visit their documentation site.
The integration of KDB.AI and LangChain empowers developers with real-time vector processing capability and state-of-the-art NLP models. This combination opens new possibilities and use cases for enterprise AI, such as:
If you’re interested in trying out KDB.AI on LangChain, I invite you to follow these simple steps.
We also have some great resources from our evangelism team, including samples over on the KDB.AI learning hub and regular livestreams. And should you have any feedback, questions, or issues a dedicated team over on our Slack community.
Happy Coding!
For many years, KX and its partners have looked to provide solutions that simplify database management in kdb+, this has seen the launch of several products and frameworks, including kdb Insights Enterprise, kdb Insights Database, and Data Intellects, TorQ.
With the introduction of PyKX nearly 2 years ago, we delivered an initial new wave of capability, increasing access to our powerful analytic tooling, via a familiar python interface and opening kdb+ data estates to a new wave of developers. Over the years this has continued to evolve and harden capabilities.
Earlier this week, we released the next phase in this journey as part of PyKX 2.3. Specifically, through the beta release of a new feature; centred around “database management”, providing greater flexibility in the provisioning and management of kdb+ databases via Python.
With the initial release, developers will be able to:
Click here for a full breakdown of the API.
Let’s explore some of these features further by walking through example management tasks.
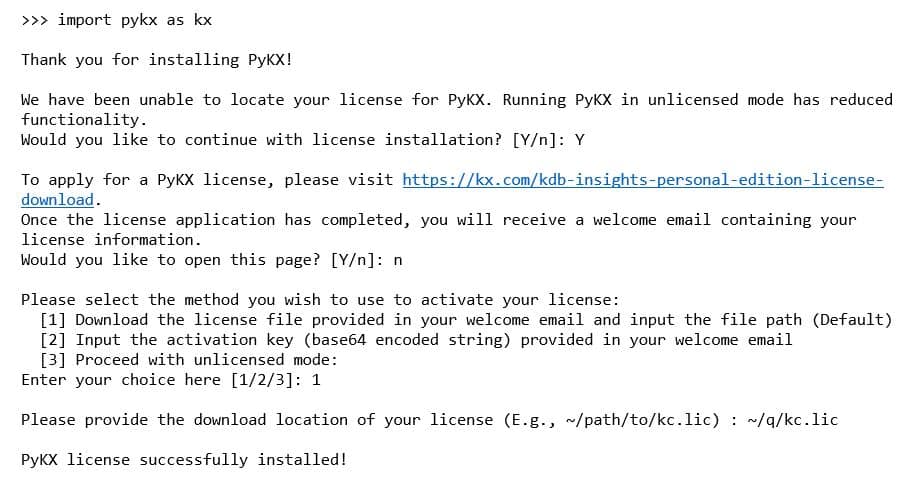
To begin, you will need to enable PyKX beta features:
import os
os.environ['PYKX_BETA_FEATURES'] = 'True'
import pykx as kx
Once initialised, you can validate what features are enabled by running the following command.
print(kx.config.beta_features)
print(kx.beta_features)Next, create a new directory to host your database and initialise the DB class.
os.makedirs('/tmp/my_database')
db = kx.DB(path='/tmp/my_database')
From here, you can generate a new dataset which will be saved to the database.
from datetime import date
N = 100000
dataset = kx.Table(data={
 'date': kx.random.random(N, [date(2020, 1, 1), date(2020, 1, 2)]),
 'sym': kx.random.random(N, ['AAPL', 'GOOG', 'MSFT']),
 'price': kx.random.random(N, 10.0)
 })
dataset| 99999 | 2020.01.02 | MSFT | 7.364259 |
|---|---|---|---|
| 100,000 rows × 3 columns | |||
| date | sym | price | |
| 0 | 2020.01.01 | MSFT | 4.802218 |
| 1 | 2020.01.01 | GOOG | 0.5058034 |
| 2 | 2020.01.01 | AAPL | 7.055037 |
| 3 | 2020.01.02 | AAPL | 2.924899 |
| 4 | 2020.01.01 | MSFT | 1.084145 |
| 5 | 2020.01.02 | AAPL | 1.1094 |
| 6 | 2020.01.01 | GOOG | 0.8396528 |
| 7 | 2020.01.02 | MSFT | 7.527356 |
| 8 | 2020.01.01 | MSFT | 7.716519 |
| 9 | 2020.01.02 | MSFT | 0.7148808 |
| 10 | 2020.01.01 | MSFT | 2.539819 |
| 11 | 2020.01.02 | GOOG | 9.568963 |
| 12 | 2020.01.02 | GOOG | 5.546168 |
| 13 | 2020.01.01 | GOOG | 9.614568 |
| 14 | 2020.01.01 | AAPL | 3.907669 |
| 15 | 2020.01.02 | GOOG | 6.349116 |
| 16 | 2020.01.01 | MSFT | 9.47742 |
| 17 | 2020.01.02 | MSFT | 3.082102 |
| 18 | 2020.01.01 | GOOG | 2.703125 |
| 19 | 2020.01.01 | MSFT | 2.438608 |
| 20 | 2020.01.02 | AAPL | 0.6931198 |
| 21 | 2020.01.02 | MSFT | 2.896335 |
| 22 | 2020.01.01 | GOOG | 2.624367 |
| … | … | … | … |
With the dataset created, save it to disk by partitioning(splitting) the data into sub-directories based on date.
db.create(dataset, table_name='db_table', partition='date')Congratulations, you have now created your first kdb+ database. You can access this table as a property of the database.
db.db_table| date | sym | price | |
|---|---|---|---|
| 0 | 2020.01.01 | MSFT | 4.802218 |
| 1 | 2020.01.01 | GOOG | 0.5058034 |
| 2 | 2020.01.01 | AAPL | 7.055037 |
| 3 | 2020.01.01 | MSFT | 1.084145 |
| 4 | 2020.01.01 | GOOG | 0.8396528 |
| 5 | 2020.01.01 | MSFT | 7.716519 |
| 6 | 2020.01.01 | MSFT | 2.539819 |
| 7 | 2020.01.01 | GOOG | 9.614568 |
| 8 | 2020.01.01 | AAPL | 3.907669 |
| 9 | 2020.01.01 | MSFT | 9.47742 |
| 10 | 2020.01.01 | GOOG | 2.703125 |
| 11 | 2020.01.01 | MSFT | 2.438608 |
| 12 | 2020.01.01 | GOOG | 2.624367 |
| 13 | 2020.01.01 | AAPL | 2.20948 |
| 14 | 2020.01.01 | AAPL | 7.839242 |
| 15 | 2020.01.01 | AAPL | 0.8549648 |
| 16 | 2020.01.01 | AAPL | 5.564782 |
| 17 | 2020.01.01 | AAPL | 3.42925 |
| 18 | 2020.01.01 | MSFT | 6.195387 |
| 19 | 2020.01.01 | AAPL | 8.137941 |
| 20 | 2020.01.01 | MSFT | 5.73365 |
| 21 | 2020.01.01 | AAPL | 7.278849 |
| 22 | 2020.01.01 | AAPL | 1.252762 |
| … | … | … | … |
| 99999 | 2020.01.02 | MSFT | 7.364259 |
| 100,000 rows × 3 columns | |||
Now, let’s explore how to add data into an existing database table by using the db.create function.
new_data = kx.Table(data={
 'sym': kx.random.random(3333, ['AAPL', 'GOOG', 'MSFT']),
 'price': kx.random.random(3333, 10.0)
 })

db.create(new_data, 'db_table', date(2020, 1, 3))Next, you can rename your table to ‘finance_data’ and the column ‘sym’ to a more descriptive name.
db.rename_table('db_table', 'finance_data')
db.rename_column('finance_data', 'sym', 'ticker')With more significant editing tasks, you may want to perform the operation on a practice column and protect your original dataset. To demonstrate, create a copy of the ‘price’ column and then perform a function to double the content values. Finally, modify the data type of your new column to be less memory intensive.
db.copy_column('finance_data', 'price', 'price_copy')
db.apply_function('finance_data', 'price_copy', lambda x:2*x)
db.set_column_type('finance_data', 'price_copy', kx.RealAtom)
We can now look at the content of finance_data to see how these changes have modified the database.
db.finance_data| date | ticker | price | price_copy | |
|---|---|---|---|---|
| 0 | 2020.01.01 | MSFT | 4.802218 | 9.604437e |
| 1 | 2020.01.01 | GOOG | 0.5058034 | 1.011607e |
| 2 | 2020.01.01 | AAPL | 7.055037 | 14.11007e |
| 3 | 2020.01.01 | MSFT | 1.084145 | 2.16829e |
| 4 | 2020.01.01 | GOOG | 0.8396528 | 1.679306e |
| 5 | 2020.01.01 | MSFT | 7.716519 | 15.43304e |
| 6 | 2020.01.01 | MSFT | 2.539819 | 5.079639e |
| 7 | 2020.01.01 | GOOG | 9.614568 | 19.22914e |
| 8 | 2020.01.01 | AAPL | 3.907669 | 7.815337e |
| 9 | 2020.01.01 | MSFT | 9.47742 | 18.95484e |
| 10 | 2020.01.01 | GOOG | 2.703125 | 5.40625e |
| 11 | 2020.01.01 | MSFT | 2.438608 | 4.877215e |
| 12 | 2020.01.01 | GOOG | 2.624367 | 5.248734e |
| 13 | 2020.01.01 | AAPL | 2.20948 | 4.41896e |
| 14 | 2020.01.01 | AAPL | 7.839242 | 15.67848e |
| 15 | 2020.01.01 | AAPL | 0.8549648 | 1.70993e |
| 16 | 2020.01.01 | AAPL | 5.564782 | 11.12956e |
| 17 | 2020.01.01 | AAPL | 3.42925 | 6.8585e |
| 18 | 2020.01.01 | MSFT | 6.195387 | 12.39077e |
| 19 | 2020.01.01 | AAPL | 8.137941 | 16.27588e |
| 20 | 2020.01.01 | MSFT | 5.73365 | 11.4673e |
| 21 | 2020.01.01 | AAPL | 7.278849 | 14.5577e |
| 22 | 2020.01.01 | AAPL | 1.252762 | 2.505525e |
| 103332 | 2020.01.03 | MSFT | 4.152568 | 8.305137e |
| … | … | … | … | … |
| 103,333 rows × 3 columns | ||||
Let’s also check the number of data rows, per partition within the database.
db.partition_count()| date | finance_data |
|---|---|
| 2020.01.01 | 49859 |
| 2020.01.02 | 50141 |
| 2020.01.03 | 3333 |
Finally, using the create function that you used earlier, and the fill_database function, you can add the missing partitions to a newly onboarded table.
orders = kx.Table(data = {
    'id': kx.random.random(100, kx.GUIDAtom.null),
    'type': kx.random.random(100, ['Buy', 'Sell'])})

db.create(orders, 'orders', date(2020, 1, 3))
db.fill_database()You can see that the orders table has now been onboarded and is accessible.
print(db.tables)
db.orders| [‘finance_data’, ‘orders’] | |||
|---|---|---|---|
| date | id | type | |
| 0 | 2020.01.03 | 29f1e3e9-dba5-12da-acf8-51154deb3dc9 | Buy |
| 1 | 2020.01.03 | 5cda0be6-60a5-07fc-f929-a3d03c6106d1 | Buy |
| 2 | 2020.01.03 | 47d62791-e47a-e8ee-1afa-09cfe0657581 | Buy |
| 3 | 2020.01.03 | b15ac75d-4bd9-a6af-5882-fc9f2e0771c1 | Sell |
| 4 | 2020.01.03 | 2df69841-083e-77d4-1dd6-cf3919e8c19d | Sell |
| 5 | 2020.01.03 | 9e98c564-1f25-ca7d-9b3d-b270a2acf79f | Sell |
| 6 | 2020.01.03 | 8b4fe1cb-da0c-8589-f9b5-8faa57f73ab2 | Sell |
| 7 | 2020.01.03 | 2a47001a-0ffd-8a0e-3b42-45a5f11980a1 | Buy |
| 8 | 2020.01.03 | 8113ba9a-7065-6471-5b58-4c194c9a2360 | Sell |
| 9 | 2020.01.03 | 0418a02c-a1c3-db83-e82e-ff5d3b4ef847 | Buy |
| 10 | 2020.01.03 | 52a1be39-1ceb-87b7-0e4d-f156f32860a0 | Buy |
| 11 | 2020.01.03 | 1a536bf8-5f1f-5a6e-83de-0c6f8d632c8a | Buy |
| 12 | 2020.01.03 | 2de7b0aa-67a7-2150-aeb9-d2cd5ac855b8 | Buy |
| 13 | 2020.01.03 | 1f6bf7de-b72a-4acb-9c80-207f7be4cd96 | Buy |
| 14 | 2020.01.03 | c22bcb71-61f7-5431-54e0-a5bb315680e2 | Sell |
| 15 | 2020.01.03 | ed925950-bccf-4684-1a7b-09ce2ecd4edc | Sell |
| 16 | 2020.01.03 | 2fd437b0-0a61-d5b2-6749-c48cd7344561 | Sell |
| 17 | 2020.01.03 | 5961b504-53d0-1cf5-ace6-234bf7569f0b | Buy |
| 18 | 2020.01.03 | 8bf69a5e-5225-b873-5759-d52b70bfa40b | Buy |
| 19 | 2020.01.03 | 898bfe1e-6445-bf9c-932d-d2cbff828d11 | Buy |
| 20 | 2020.01.03 | 34b6cff5-3a4c-cd4b-2be0-bef15fe4b031 | Sell |
| 21 | 2020.01.03 | 41958ee9-09a9-45c7-ce71-0c0fcd12555c | Sell |
| 22 | 2020.01.03 | 520d5ab7-ca9a-ff07-c89e-051f0379908d | Buy |
| … | … | … | … |
| 99 | 2020.01.03 | 1672522c-87d2-ad8f-85d3-f55662b189cb | Buy |
| 100 rows × 3 columns | |||
Creating and managing databases at scale is a tough challenge and one where mistakes in operations can have a meaningful impact on business performance and use-case efficiency. While the Database Management feature does not solve all problems in this area, it is intended to provide you with an initial grounding. Allowing you, in Python, to create and perform basic operations on kdb+ databases to make this task easier.
As mentioned throughout the blog, this is presently a beta feature and subject to updates prior to a general availability release later this year. If you run into difficulties with this feature, or have suggestions for additional functionality, please open an issue on our public GitHub or alternatively open a pull request.
Beware predictions! Many are made, most are forgotten, but some can come back to haunt you. So, it was with some trepidation we revisited predictions from 2018 on how Analytics-as-a-Service might become “the next big thing.”
Back then, the worldwide spend on public cloud services was predicted to grow by 17% over the next four years and SaaS to increase by 20%. Figures in 2021 revealed the actual SaaS growth was 21% and later figures in 2023 show it maintained that same trajectory. Gartner got it right back then and Precedence Research now predicts it will be followed by a healthy 14% increase by 2032. But what about our predictions on how the market for SaaS Analytics services might unfold?
Due to the massive proliferation of sensor readings across tools and plants, we forecast that “processing real-time data and drawing on historical data will enable the predictive maintenance system to anticipate critical situations before they happen and send out the appropriate alert when a problem is identified.”
Did it come true?
A recent Verified Market Research report noted that the market continues to expand because of “the need for real-time data insights, the rising popularity of big data and data science, and the rising acceptance of cloud-based solutions.”
So, the business drivers have remained constant – using predictive maintenance to reduce downtime, faults, and emergency repairs to increase asset availability and in turn grow yield and lower costs.
We envisioned that the availability of SaaS-based analytics would lower the cost of entry and make it accessible to a wider market of potential users.
At the time, the high cost of infrastructure, difficulty accessing data and analytics, and the high-level training and skills required for personnel managing predictive programs were a challenge for all but the bigger corporations.
Did it come true?
Reports from Tracxn, a financial data aggregator, confirm that established companies like Altair, Augury and PTC now provide SaaS-based manufacturing analytics services to their portfolios. They are complemented by the services of new dedicated SaaS Analytics entrants like Siera.AI mentioned in a recent report from whoraised.
Equipment manufacturers like Siemens and Applied Materials now extend proprietary analytics and diagnostics services to a wider set of equipment across the organisation. This approach mirrors the provision of trading analytics services by tier 1 finance brokers to tier 2 and tier 3 customers in KX’s other major vertical, financial services.
In response, we developed PyKX, a Python-first interface for the q language and its time-series vector database kdb. The great benefit of PyKX is that it enables Python developers to continue working with familiar tools and existing libraries to explore data using the speed and power of kdb.
PyKX coupled with kdb’s unrivalled high performance and scalability helped it address the second unforeseen.
By enabling the reuse of existing libraries in the training of models over vast amounts of data, AI has enabled faster rollout and operation of machine learning initiatives.
The lesson learned is that while everyone knows it’s best to anticipate and prepare, sometimes you have to be nimble and react.
For some things you don’t need a crystal ball to reveal them. The benefit of processing real-time data augmented by historical data for trend-analysis machine learning is a simple example. Doing so enables predictive maintenance systems to anticipate critical situations, take corrective (and ideally automated) action or, at minimum, instant alerting when a problem is identified.
To deliver these services, data from a myriad of sensors and devices, along with relevant asset parameters and algorithms, must be combined in a platform capable of handling high volume and performance demands.
Discover more about the ROI of real-time analytics.
by Steve Wilcockson
When the artist most synonymous with Ragtime, Scott Joplin, learnt the piano, serious musical circles felt Ragtime was too “Tin Pan Alley.” Joplin would blend styles and formalize compositions that would be re-played with the same fidelity as when he wrote them, for example, The Entertainer.
So, what do Scott Joplin and Ragtime have to do with Generative AI tech and KDB.AI Server Edition?
First, Generative AI must be carefully teased, like the notes of Scott Joplin’s The Entertainer. “Playing the right notes in the wrong order,” is akin to a GenAI-inspired hallucination that could lead to an adverse outcome: a flash crash, or a mistimed medical or political intervention.
Second, the “Ragtime” genre of yesteryear plays nicely with the RAG Time advantage of KDB.AI Server. RAG represents the Retrieval Augmented Generation orchestrated Generative AI workflow, while KDB.AI provides a natural time-based advantage.
RAG is tech’s favored approach for incorporating enterprise data into Generative AI workflows. Enterprise data stores of vector embeddings, brought to life through fast semantic search in KDB.AI, accompany Foundation and Large Language Models orchestrated through development tools like LangChain.
Organizations that implement RAG can deploy data-sets and provide guardrails around prompts and responses mitigating against LLM “hallucinations.” Like how Scott Joplin intended his compositions to be played – not over-improvised – enterprises require their AI infrastructures, particularly LLM prompt responses, to provide similar fidelity.
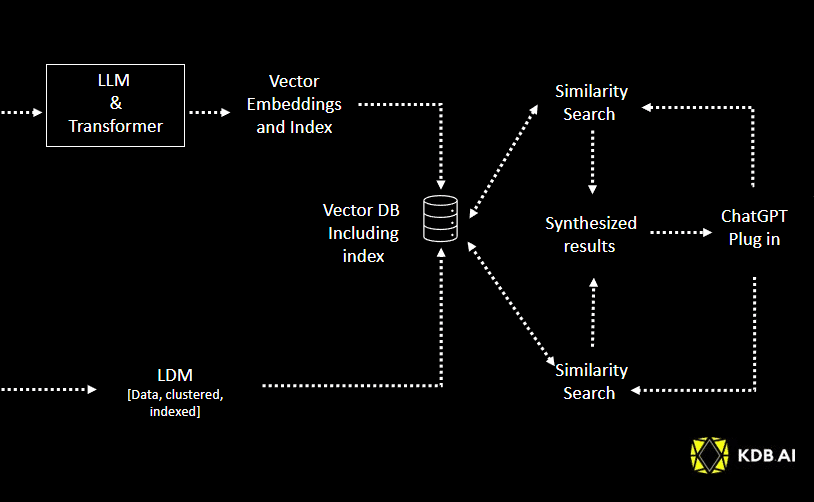
Below, “Figure 1” shows KDB.AI in a simple Naïve RAG scenario. RAG has two primary steps:

Fig 1. Simple naïve RAG architecture
With RAG, the vector embeddings saved in the KDB.AI vector database, digital encodings of text, videos, pdfs, or other data, provide information your LLM didn’t have access to when it was trained initially. For example:
With this vector knowledge store, you can explore semantic search in conjunction with your LLM environment, orchestrating with LangChain or your own data pipeline tool.
What about time? KDB.AI is built for time, incorporating temporal information into prompt responses through filtering, time windowing, and search over time.
Pre-trained models like GPT, which stands for Generative Pre-trained Transformer, are static models tied to the time at which they were trained. Handling and responding to data and analytics over time, including real-time, underpins the core technology on which KDB.AI is based. This makes the KDB.AI vector database, working alongside the pre-trained static foundation models, well suited to temporal use cases at all levels of granularity.
KX recently released KDB.AI Server, a highly-performant, scalable, vector database for real-time contextual AI that runs on-premises, hybrid, or in the cloud with a single container deployment. In short, KDB.AI Server takes the freely available developer capabilities from KDB.AI Cloud Edition, and helps CDAOs, CTOs, and their business-facing teams build fast and run their data anywhere, in secure, enterprise, or customer-managed deployments. Vector database functionality is ported to the enterprise architecture of choice. You can:
Note the deployment benefits of KDB.AI Server. KDB.AI’s efficiency in filtering and searching vector datasets, deploying unlimited numbers of time windows, and no performance hits, means less need for GPUs and other expensive hardware. You can deploy to your existing hardware, on-premises and/or on cloud, in conjunction with your enterprise data resources and production environments.
Let’s explore some time-related prompts to understand the use cases KDB.AI can be applied to. Fig 2 shows a prompt response asking, “What products did Apple release in 2020?”
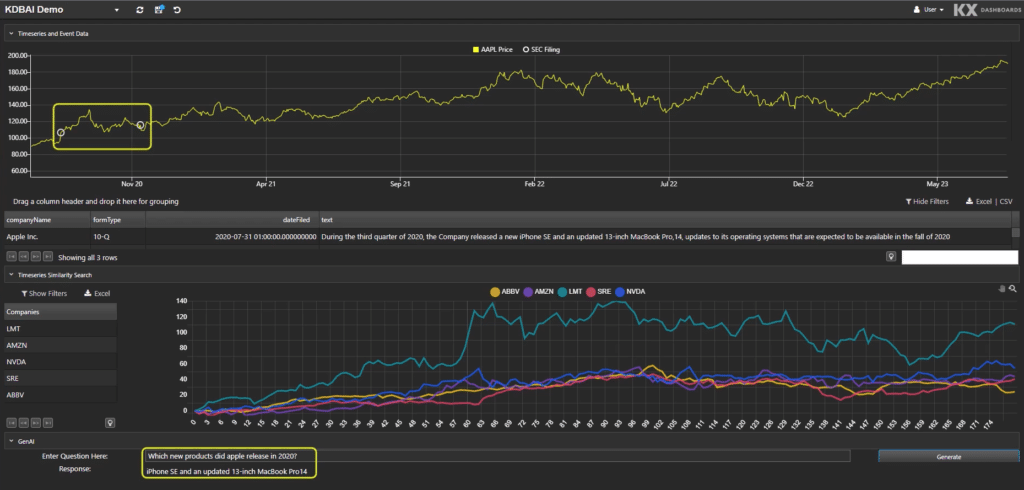
Fig 2. What products did Apple release in 2020?
The answer is returned in the bottom left: “iphone SE and an updated 13 inch Macbook Pro14.” If we’re focussed on market activities, we can now ask “What was the response of the share price during the period?”
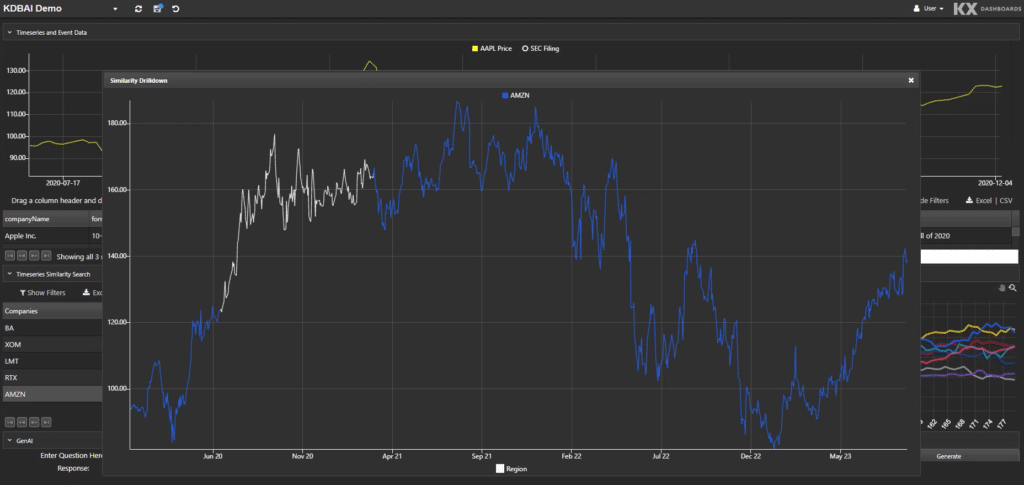
Fig 3. What was the impact to Apple’s share price?
Our queries can extend further. KDB.AI can recognize patterns and provide charts, highlight key source release information from original documents, quantify impacts, and compare with similar trends from prior years or different releases.
Were we a retailer with similar interests in Apple launch metrics, holding our own and industry-aggregated retail data-sets, instead of assessing the impact on share price, we could probe the impact on sales. We may, for example, compare our own sales figures, including the most recent ones, alongside the aggregate market knowledge “known” by the LLM. We might then benchmark our company’s sales to others, identify and compare to similar launches back in time, or to launches from Apple’s rivals.
Let’s now consider a more elaborate financial workflow example. Consider an investment strategy that trades BitCoin based on streaming sentiment, for example around regulation. A vector database with an LLM in a RAG architecture provides an excellent alternative to off-the-shelf black-box sentiment feed providers, of whom there are many. We can join social media feeds with price data and assess how regulatory announcements impact price, e.g. BTC.
Step 1:
Step 2:
A sample RAG architecture is shown in Figure 4, below.
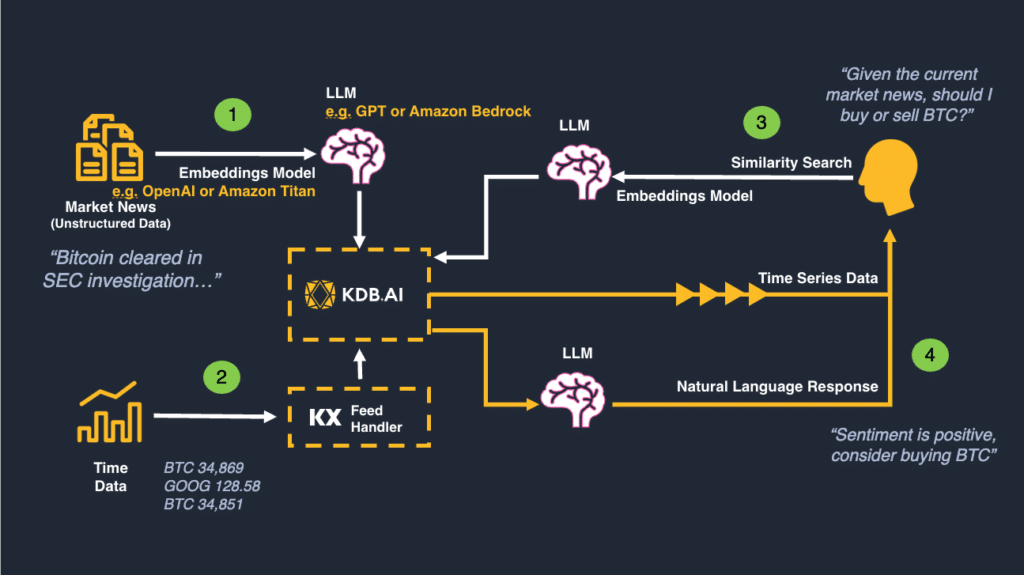
Figure 4: A Market-Driven Investment Model Process: Regulation Sentiment & BTC
With KDB.AI and a RAG architecture, we can quickly build and deploy a sentiment and price infrastructure, leverage information known by the LLM, guardrail, and make valuable with our own price and trade data to inform the investment strategy.
With your chosen LLM and RAG architecture, KDB.AI can leverage your knowledge base and provide insightful responses with speed, efficiency, and security, leveraging time to facilitate decision-making. And like the Ragtime of old, guardrail and provide structure to ensure your AI works as intended, like how Scott Joplin wanted pianists to reproduce his pieces with fidelity.
When running time-based queries, KDB.AI Server helps deploy AI routines with enterprise data-sets within your own secure firewalls – like our exemplified proprietary trading or retail data-sets alongside stores of unstructured data, e.g. analyst reports.
In our two earlier examples, we highlighted windowing and temporal analysis. Whatever your industry, be assured there is a time-based use case for you, for example:
Alternatively, please visit our dedicated Learning Hub to learn more about vector databases.
by Neil Kanungo and Ryan Siegler
No one likes a know-all – certainly not the human variety anyway, the one with an answer to every question and a view on every subject. Ironically though, that’s precisely what we want from AI systems: instant, well-informed, trustworthy responses to any question that we can act upon.
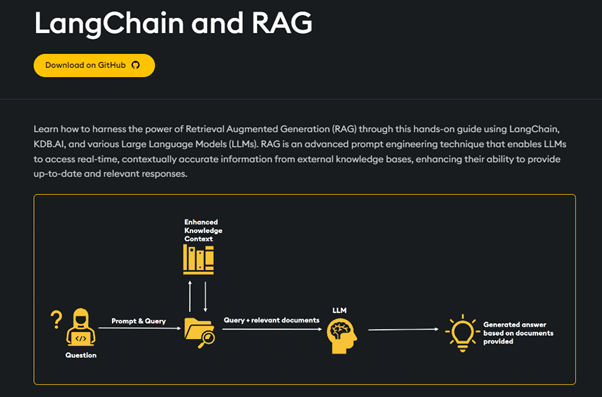
Achieving such depth of knowledge is just as challenging for a computer as it is for a human: new information pours in every second, but there are contradictory “facts”, incomplete sources, erroneous sources, and possibly inaccessible sources. So how can AI systems be infused with validated, up to date, and sometimes private information that enables them to deliver accurate, informed responses? The answer is Retrieval Augmented Generation (RAG) and KX’s Developer Advocate team is delivering a series of LinkedIn Live sessions to explain it.
Introducing RAG
In the first instalment of the series on RAG, Neil Kanungo and Ryan Siegler introduce how to implement RAG using KDB.AI, KX’s vector database, and LangChain, an open source framework for building applications with Large Language Models (LLMs). They provide some background on RAG and explain how it complements your LLM with additional information in the form of vector embeddings. Those embeddings, effectively digital encodings of text, videos, pdfs, or other data, provide information your LLM didn’t have access to when it was trained initially. Examples could include:
Whatever the class of information, RAG can help fill the gap.
RAG has two primary steps:
Conceptually, it looks like this.
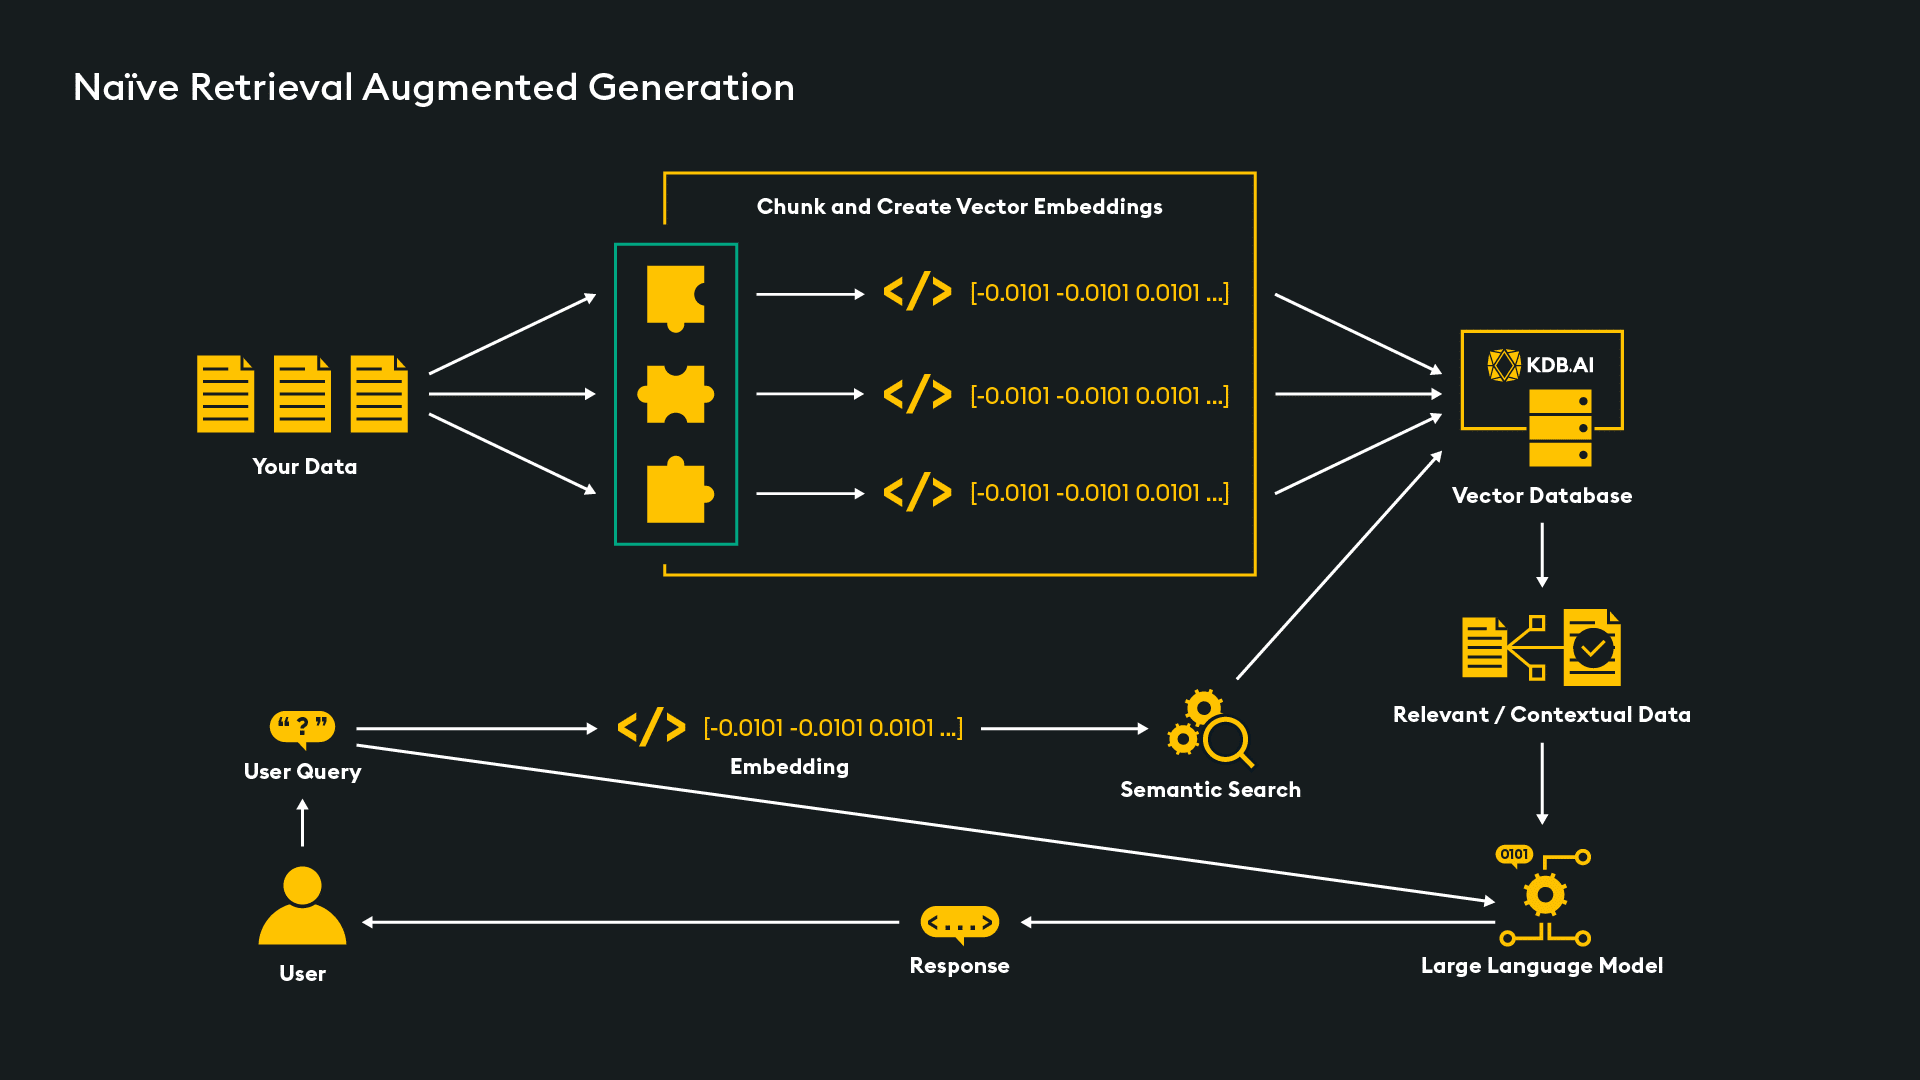
Starting at the top left, data (in our example pdfs, but it could be any other file format) is ingested and pre-processed into “chunks,” then into embeddings that are stored in the KDB.AI vector database. This database forms the augmented knowledge store for responding better to queries. When a user query (or “prompt”) is submitted, it is similarly converted into embeddings and used in a semantic search across the vector store to retrieve similar embeddings that identify additional information relevant to the query. That information is then passed along with the initial prompt to the LLM to augment it in generating its response.
This approach is referred to as “Naïve Rag” and while relatively simple to implement for Proof-of-Concepts or prototype projects, it may be inefficient in production as it operates quite indiscriminately in conducting similarity searches. For example, even when the query may be unrelated to information in the data store, it will still search, wasting resources and potentially providing irrelevant data – the very problem it was seeking to solve. One alternative approach is Agent Assisted RAG, which uses the LLM to preprocess the prompt and decide the best next step which could:
Another approach is Guardrail RAG which can set boundaries on topics or questions it will respond to or give pre-determined canned responses on others.
Seeing RAG In Action
A live demo of RAG was shown, using a Python Notebook invoking both the KDB.AI vector database and LangChain, downloadable from GitHub via the KDB.AI Learning Hub.
The demo explained the installation, package imports, and API-key set-up. It showed how the text of the State of the Union address to the US Congress was imported using TextLoader, one of LangChain’s many different loaders for different source formats. LangChain was shown to include different chunkers (text splitters) to pre-process data, offering controls over chunk sizes and supporting overlapping when required, depending on the source data profile. A follow-up article will discuss this topic in more detail. OpenAI’s embedding model was then used to create the vector representation of each of the chunks. These are consequently stored in KDB.AI where the schema is specified along with details of the chosen search algorithm. Now, the system is able to deliver RAG-based responses to user queries.
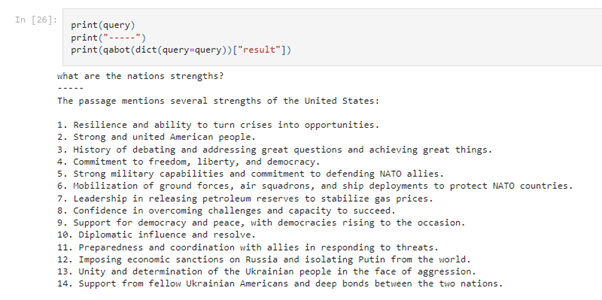
In the demo, Ryan asked “What are the nations strengths?” and the similarity search returned (Retrieved) a subset of the State of the Nation address that it added to (Augmented) the query when submitted to the LLM. To illustrate how LLMs could deliver variable responses, it was sent separately to the OpenAI (GPT3) and Hugging Face LLMs.
The OpenAI response delivered a concise “The American people are strong and capable of turning any crisis into an opportunity.”

The Hugging Face response is a more succinct “Possibilities” reflecting the fact that its model is designed more for short and concise answers as opposed to the more discursive nature of GPT.

The potential for even further variation is illustrated by using a different generation model (GPT 3.5 Turbo) and by selecting a different retrieval algorithm, which in turn provides different augmentation text to the LLM. The example below uses RetrievalQA, which enables augmentation of a configurable number of chunks. In this case, 10 is configured and OpenAI responds with a longer list of characteristics based on that additional information in the prompt.
A valid concern when rolling out AI-driven applications is the risk of invalid, inaccurate responses, or so called “Hallucinations”. The power of KDB.AI coupled with the convenience of LangChain can help organisations quickly and easily use RAG to mitigate those concerns by augmenting their selected LLM with additional, well-defined and curated information.
Watch the webinar in full or follow KX on LinkedIn to follow each new episode in the series.
By Steve Wilcockson
Our whitepaper, Cultivate Sustainable Computing and Environmentally Responsible Analytics in an AI Age, had me thinking, how many of us strive for sustainability, only to fall short? I recycle, shop locally, live in a small house, and advocate for environmental causes. Yet my family drives two petrol-guzzling cars, we regularly fly short-haul, and our drafty one-time Tudor merchant house is anything but energy-efficient.
My passive environmentalism helped draw me to KX. Yes, I love the analytics, Python, and AI, but it was my previous experience in enterprise middleware, which helped me realize computing should be much greener.
Everywhere I looked in middleware, I saw computational waste. I don’t mean technical debt. I mean inefficient compute, inefficient memory utilization, and over-complicated stacks, probably held together by spiderwebs of APIs and Kubernetes processes. This comes from the programming languages used in the core tooling, and cultures that reward performance over efficiency. Let’s explore.
When in middleware, I worked in the Java ecosystem. It could have been Python, C++, JavaScript. But I worked with Java, and it so happens that many big data tools are built in the so-called Java Virtual Machine, such as Kafka, Cassandra, Spark, Solr, ElasticSearch, Solr, Hadoop, ZooKeeper, and Flink. Python and JavaScript, also relevant to data analytics, use similar virtual machines or runtime environments.
Runtimes are great for development. They encapsulate general-purpose functionality and facilitate “write once, run anywhere” development. Trouble is, runtimes tend to “price” for all use cases and the hardest workloads – memory utilization, compute. It’s a bit like driving ten cars rather than one to the grocery store, with all ten prepped to drive thousands of miles.
In Java’s case, glitches and inconsistent performance mean users must assign memory and compute accordingly. This affects its performance and efficiency. Python, with its own runtimes, has struggled with the so-called Global Interpreter Lock (GIL for short), which has impacted its ability to optimally thread processes and thus run efficient compute.
Such factors have been compared in the often-cited Energy Efficiency Across Programming Languages Survey where Java seemingly performs better than Python. The survey is somewhat academic and should not be read too literally, but it highlights the green credentials of programming languages that underpin enterprise and data stacks.
Who hasn’t seen a highly elaborate architecture presented at a conference or in an engineering blog? Has the presenter or author sought to “wow” you with their stupendous ability to navigate multiple tools? Sometimes, those “complexity wows” get institutionalized, like with the legendary Hadoop stack with its plethora of confusingly named components, like Hive, Yarn, Pig, HBASE, etc. When a complex stack meets key SLA targets, normally latency, throughput, and carrying capacity, the green efficiency of the bloated stack hasn’t always been scrutinized. “Job done” matters more than “how well it was done.”
In AI, Matt Turck’s oft-cited AI landscape illustrates something similar and is exacerbated further by compute-intensive LLMs and GenAI workflow injections. So troublesome is the GenAI stack compute load on the environment that the topic is discussed frequently in the Telegraph, New York Times, and Economist. For example, ‘did you know a 50-question interaction with an AI chatbot can consume around 500mls of water?’
In sum, the modern stack has been complacent about languages and the proliferating nature of applications, which GenAI compute exacerbates. Unchecked by proper measurement, data centers – which power the everyday needs of you and me – can consume the electricity consumption and carbon footprints of large nations!
KX is built differently to service the heaviest analytics workloads, from the biggest data sets and the fastest streams to the most intensive AI application. Not a single byte of code or memory is wasted. With KX you can:
For Environmental Social Governance (ESG) analysis, KX ingests, aggregates, and analyzes disparate and inconsistent data. For industrial applications, it ingests data from sensors, databases, and shopfloor metrics, providing observability, which, in turn, provides insights to reduce waste.
Environmental efficiencies should equate to cost efficiencies and performance improvements.
For cloud scale – measured economically by FinOps – cost optimizations come to the forefront. FinOps, CloudOps and AIOps practitioners should complement common Performance SLAs with Cost per Query and Queries per Watt indicators, like in the following chart.
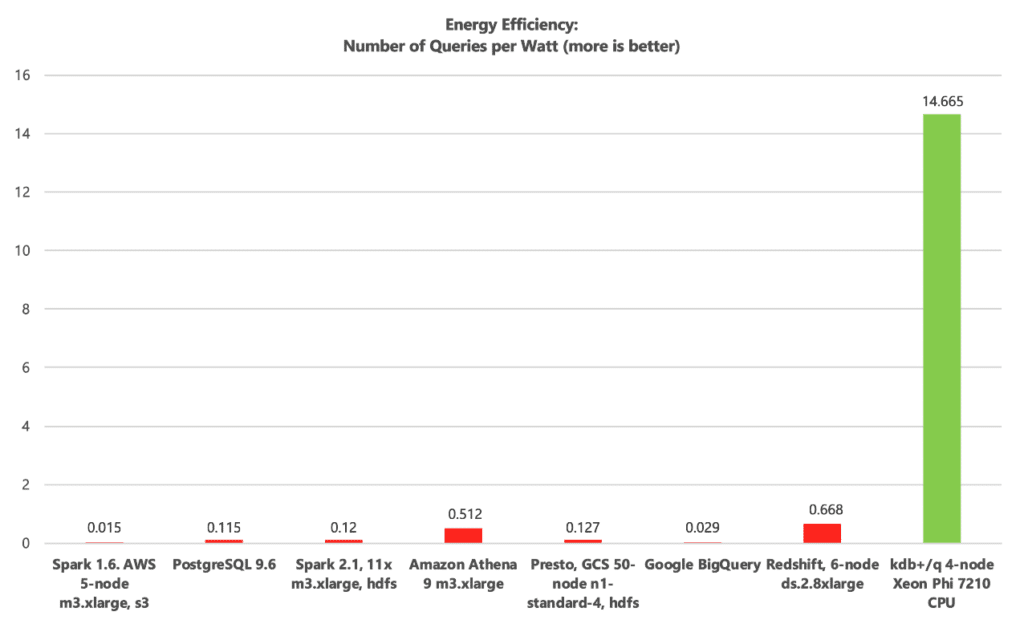
In an ideal world, Queries per Watt (sustainable computing), Cost per Query (FinOps) and SLA efficacy (throughput over a given time) should correlate. When they do, performance, cost and sustainability harmony ensue. When high performance comes at the cost of low numbers of Queries per Watt and/or high Cost per Query measures, bloat ensues, exacerbated at cloud and GenAI scale.
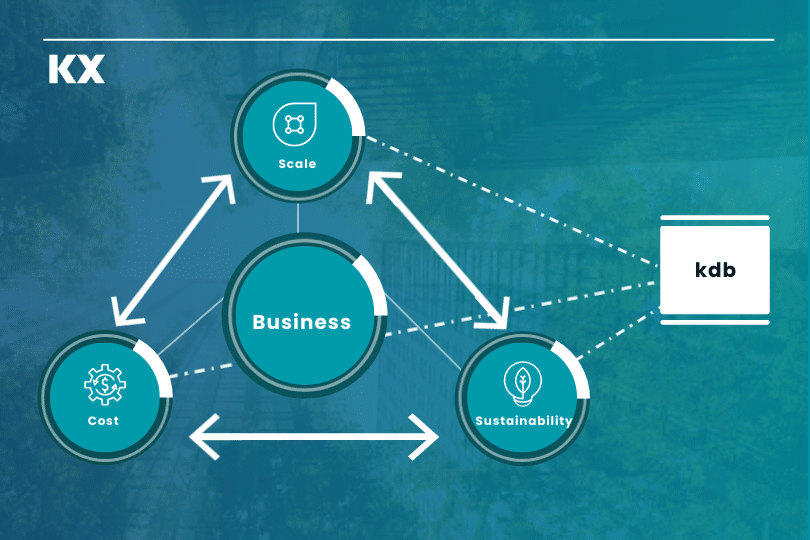
(Above) The Virtuous Trinity of Cloud Scale Analytics: Optimal Scaling in the Presence of Lowest Costs
Download our whitepaper, ‘Cultivating Sustainable Computing and Environmentally Responsible Analytics in an AI Age’ if you’re interested in ESG issues and want practical solutions to your business needs.
I also recommend following and engaging with the Green Software Foundation.
The Gartner® Assess the Value and Cost of Generative AI With New Investment Criteria
report provides a decision framework for assessing and realizing value from enterprise generative AI initiatives. Organizations need to architect transformative use cases that deliver competitive advantages amidst industry disruption from new GenAI products and business models. I found the report’s accompanying background strategic planning assumptions striking. According to Gartner:
By 2025, growth in 90% of enterprise deployments of GenAI will slow as costs exceed value, resulting in accelerated adoption of smaller custom models.
By 2026, more than 80% of independent software vendors (ISVs) will have embedded generative AI capabilities in their enterprise applications, up from less than 1% today.
By 2028, more than 50% of enterprises that have built their own large models from scratch will abandon their efforts due to costs, complexity and technical debt in their deployments.
For the remainder of this blog, I’ll give my perspective on the techniques and technologies that can help you reach those right transformative use cases and highlight the role of the vector database.
First, some context about the democratic opportunity for all. Generative AI is a great disruptive leveler. All firms and sectors can stand on the shoulders of giants to be successful. Past leaders in AI exploitation may not be the future leaders. They who dare, win.
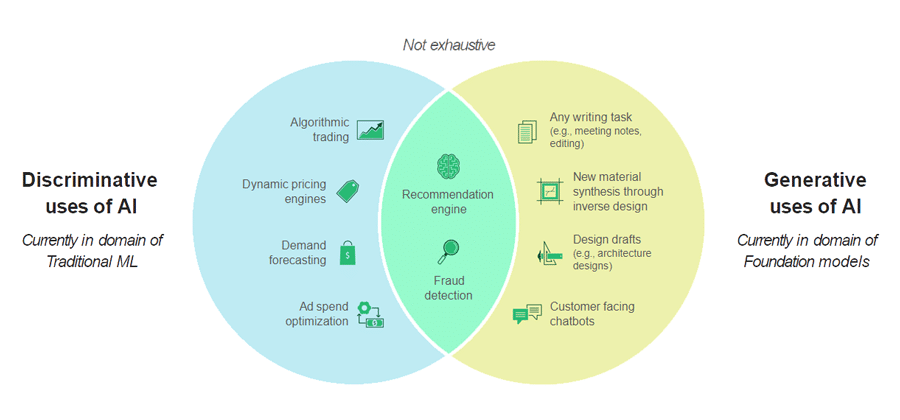
From support and marketing chatbots to automated customer emails, most organizations have AI projects under way. Perceived industry leaders in big tech, high tech, and capital markets have long used structured data and “discriminative AI” to observe, predict, and find anomalies. They have serviced use cases such as detecting fraudulent transactions or trades, predicting equipment failures of key assets (defense, space, manufacturing, connected vehicles), personalizing social media recommendations, or dispensing robo-advice.
Some sectors may appear to be less out there, e.g. consumer, health, and insurance, but if you take this view don’t be complacent. Many actuaries claim they were the original data scientists and predictive modelers, and they have a point. Reinsurance stacks are every bit as sophisticated as the smartest hedge funds, servicing more challenging pricing and risk regimes. I know, I’ve worked with both. Medical devices have long been a focus of AI, while predictive healthcare has already affected my health, in a good way.
Whatever your starting point, I offer three tips for successfully implementing differentiating and transformative use cases soonest, with the least technical debt:
1. Prepare data well – It’s not enough to have data; it needs to be in the right format, organized, and engineered quickly. Make sure your tooling can expedite essential data engineering operations efficiently, for example, join disparate data-sets and perform filtering and aggregation.
2. Select the Large Language Model (LLM) that’s right for you. There’s no right answer. “Open source” (e.g. LLaMA, Falcon) versus proprietary (e.g. GPT, Bard) gets debated online. We at KX strive to give you the option of working with different LLMs, as we do other LLM-neutral developer tooling such as LangChain. AWS’s Eduardo Ordax’s guidance on LLMOps and what he calls FMOps (Foundational Model Ops) is also helpful:
3. Determine your optimal “taker, shaper, or maker” profile
Until now, I’ve not referenced a vector database. A vector database is a shaper technology that I believe offers the greatest opportunity to implement your golden use cases. Think of a vector database as an auxiliary to an LLM. A vector database helps you quickly find the most similar embeddings to a given embedding with customization. For example, if you’ve embedded the text of a search query and want to find the top 10 documents from your organization’s legal archive most similar to the query in order to assess the new case.
Vector databases should therefore help you incorporate contextual understanding with your own data into the search. In short, use vector embeddings of your own datasets to augment queries to your favorite LLM with supporting validated information. Then, query and search for contextualized differentiating and transformational use cases relevant to your organization, reducing risks of hallucinations.
Not all vector databases are the same. Some are more flexible with datatypes allowing combinations of generative and discriminative AI. KDB.AI is one such database. Make sure your vector database is efficient. Think of the environmental and financial costs of your search. Ensure your database matches your business needs. If your organization requires searches with to-the-minute data sets, choose one which can work with edge workflows. Choose wisely.
No need for most organizations to “make,” but stand on the shoulders of giants to “shape” for optimal impact and YOUR golden use cases.
Download the Gartner ‘Assess the Value and Cost of Generative AI With New Investment Criteria’ report.
Alternatively, visit KDB.AI to learn more about vector databases.
Gartner, Assess the Value and Cost of Generative AI With New Investment Criteria, Rita Sallam, James Plath, Adnan Zijadic, Pri Rathnayake, Graham Waller, Matt Cain, Andrew Frank, Bern Elliot, 13 July 2023. GARTNER is a registered trademark and service mark of Gartner, Inc. and/or its affiliates in the U.S. and internationally and is used herein with permission. All rights reserved.
This KX article is by Steve Wilcockson
By Rian Ó Cuinneagáin
PyKX is an interface between Python and kdb’s vector programming language q and its underlying data types. By taking a Python-first approach, it makes the power of kdb+’s vector and time-series analytics easily available – indeed almost transparently available – to those of a more Pythonic bias. The result is to enable anyone with Python knowledge to develop and run high-performance real-time analytics against vast amounts of data without necessarily knowing the details of q or kdb yet benefitting from their undisputed power.
PyKX was first released in February 2022 and has evolved significantly in response to user feedback. Below is a summary of highlight changes in 2023 up to the latest version, 2.1.1.
First, we should note its different modes of operation.
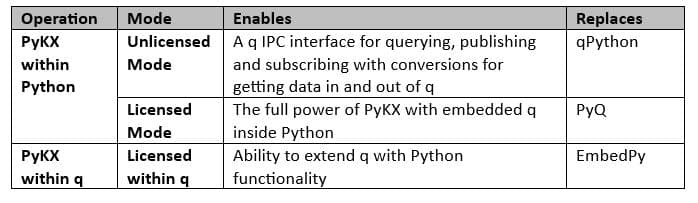
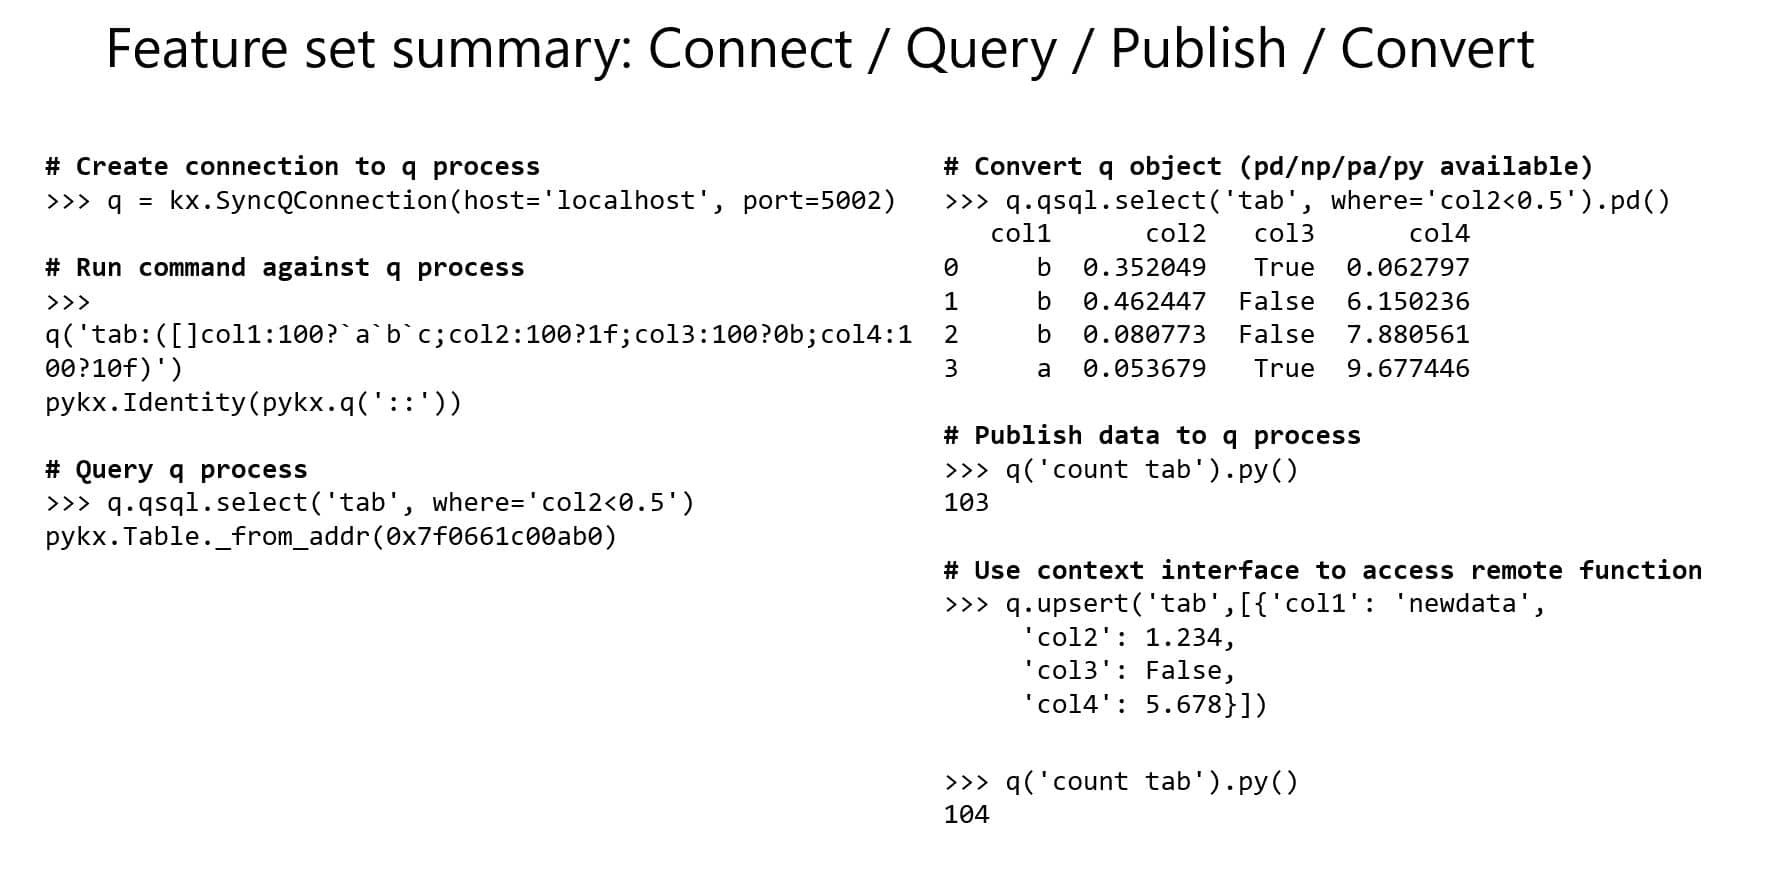
The unlicensed mode enables users to make connections to q processes and run remote commands. The example below shows how a table can be created in a remote q process and then queried using the more Pythonic-like q.sql.select syntax for building up the query rather than the standard “select from tab where..” of q itself.
Note that because q is not included within the Python process (as it is the unlicensed version), a pointer rather than the q object representation. The right-hand side shows, however, that users can choose the format they want the data converted to with options including Python, Pandas, PyArrow, or NumPy. Also illustrated is the ability to use the more intuitive context interface – first to include a Python dictionary in an q.upsert command for adding data to a table and then using count to verify its successful commit.
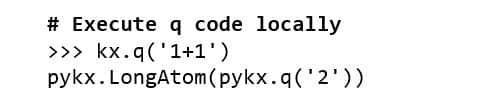
Licensed mode provides much greater standalone power as it removes the need for a separate q process. Python is running the main loop and it has effectively all the power of q bar the ability to run timers and to operate as server/client simultaneously. As a simple example, we see below how the response is presented as q object, in this case “2”, rather than simply a pointer as in the unlicensed example above.
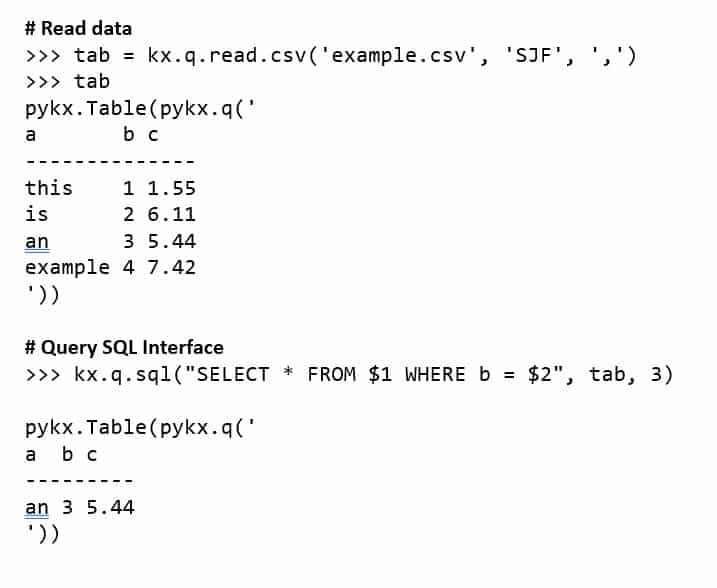
Below is an example of new 2.1 functionality for reading csv files – in this case wrapping the q command in a Python library rather than demanding the use of the “0:” syntax. Similarly, familiar SQL syntax can be used for making queries. SQL syntax can also be used in unlicensed mode if the server-side process enables this feature.
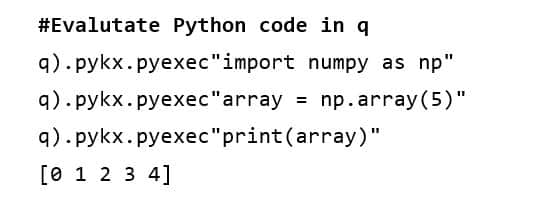
Entering \l pykx.q within a q process presents an environment very similar to embedPy that this mode replaces. The differences relate to namespace changes required to convert previous embedPy code to PyKX and how strings and symbols are transferred between q and Python. Previously, both strings and symbols were mapped to strings in Python, meaning that round tripping could not be undertaken due to the associated information loss. In the new PyKX implementation, a kdb string becomes a byte list in Python and a symbol becomes a string which, with some refactoring, facilitates round tripping.
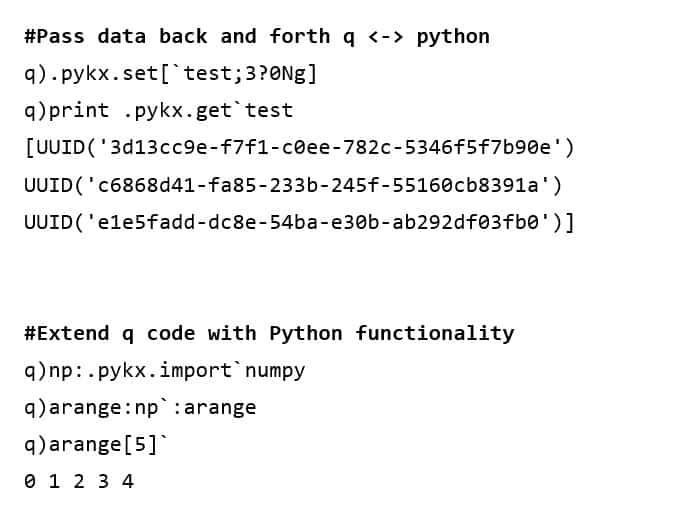
Further functionality is illustrated below. In the first case, pykx.set and pykx.get can be used to pass data over and back between q and Python, and in the second case, the ability to extend q code with Python by indexing into a library and calling specific functions as if they were native q functions. Note using the backtick, which triggers the Python result to be converted to a q object. This allows you to chain multiple Python functions and choose when you wish to convert the final result only using `.
Changes have been made to make installation and configuration easier. An interactive session guides users through getting a license with an email enabling them to either configure it as a file on a specific path or proceed with the given key within the Python session (particularly convenient if running on a remote server and eliminating the need to get a file transferred to it).
In addition to controlling configurability via environment variables, it’s now possible using a .pykx config file. Moreover, it’s possible to define multiple configurations, for example, one for test and one for staging, and then select the appropriate one at startup. Challenges in detecting LibPython have been made easier by enabling users to specify its location should automatic detection be unsuccessful. Finally, a debug utility has been added to capture environment information to assist problem diagnostics and resolution at installation.
As the goal for PyKX is to provide a Python-first experience, we’ve added support for the latest Pandas 2.0 releases. The table below presents what is now available in the PyKX Pandas-like API.
Below is an example of using this functionality.
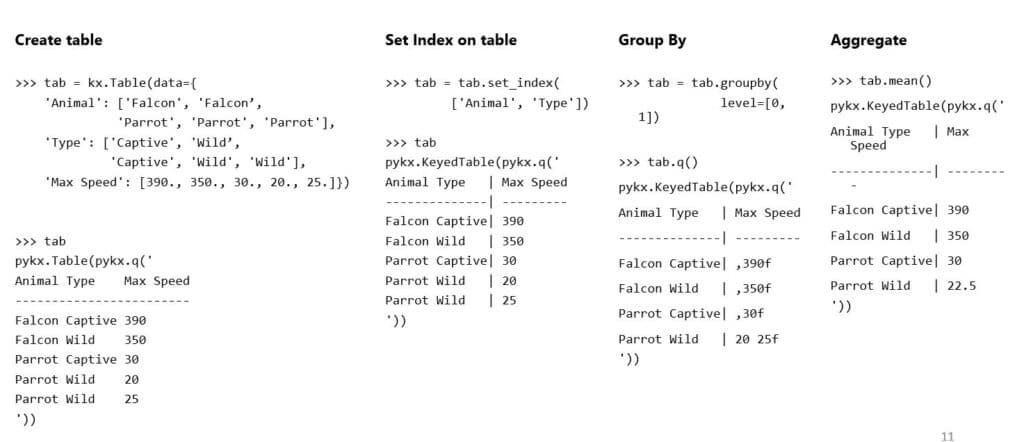
It may be noted that some keywords have been omitted. This is simply because in some cases they may not be appropriate. An example is drop=False for set_index as kdb tables should not include duplicate column names
Notebooks now support HTML rendering of tables and dictionaries (pykx.Table, pykx.Dictionary, pykx.SplayedTable , pykx.PartitionedTable and pykx.KeyedTable objects) via _repr_html_. Some examples are presented below: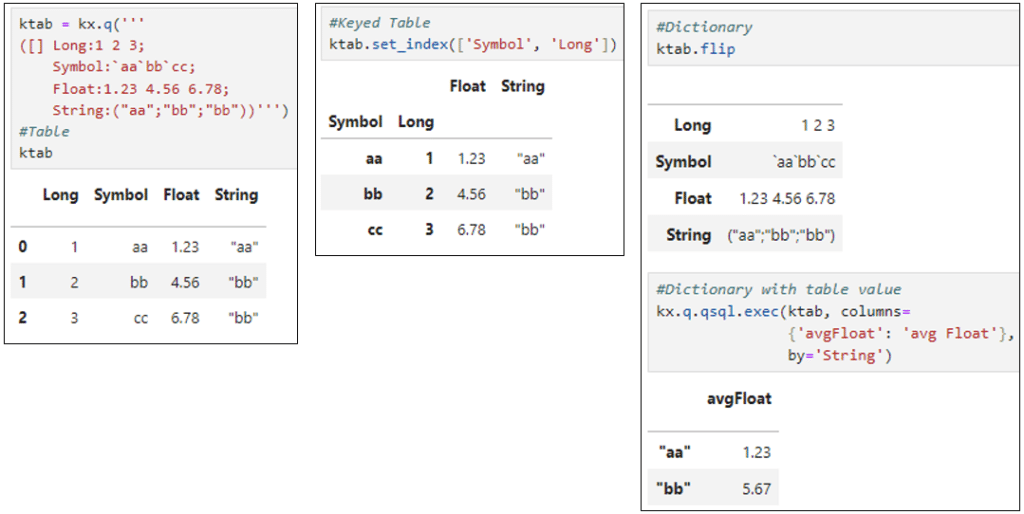
Also included is truncation for long and/or wide tables, including partition and splayed tables, with row and column count and last line display for truncated tables. Previous q style output is still available using print.
Discover more information on these and other features.
Further enhancements will target the following areas:
Finally, what better endorsement of a product than the words of a customer. Watch Citadel discuss their use of PyKX at this year’s KXCON event.
The PyKX interface operates on Linux, Mac, and Windows and is now open source and open access from the following locations:
Rian Ó Cuinneagáin is a developer on the PyKX team at KX based in Ireland. He has worked with KX since 2014 across banking, industrial, and automotive projects among others. He is contactable via rocuinneagain@kx.com
By Steve Wilcockson
kdb+ is well known as a high-performance, in-memory database optimised for real time analytics on timeseries data. It is designed to handle large volumes of data and complex queries efficiently and cost effectively, using multithreading capabilities to optimise memory and compute resources. Those capabilities for parallel processing similarly enable horizontal scaling for extreme workloads and ultra-high-performance use cases. A number of its parallelization features are outlined below:
It is important to note that while kdb+ provides these capabilities for achieving parallelism, effective parallelization often requires careful design of data structures, queries and overall system architecture. Properly partitioning and distributing data, as well as optimizing query logic, are essential for achieving the best performance in a parallel processing environment. This whitepaper discuss these other points in more detail.
For further information on kdb please visit code.kx.com
By Steve Wilcockson
A new kdb Insights extension for Visual Studio Code (VS Code) from KX enables programmers to develop and maintain kdb Insights data analytics applications with the popular VS Code Integrated Development Environment. By enabling users to edit q files, connect to kdb processes and run queries, the plugin enables rapid development and implementation of high-performance data analytics applications powered by kdb.
VS Code is a lightweight, powerful source code editor made by Microsoft with the Electron Framework. It is designed to be open and supports multiple programming languages like JavaScript, TypeScript and Node.js as well as C++, C#, Java, Python, PHP, Go, .NET. The kdb VS Code plug-in extends that list to include q. It provides interactive code editing capabilities, including syntax highlighting, linting and code prediction for writing and visualizing the results of q queries.
The screenshot below illustrates some of its code navigation functionality.
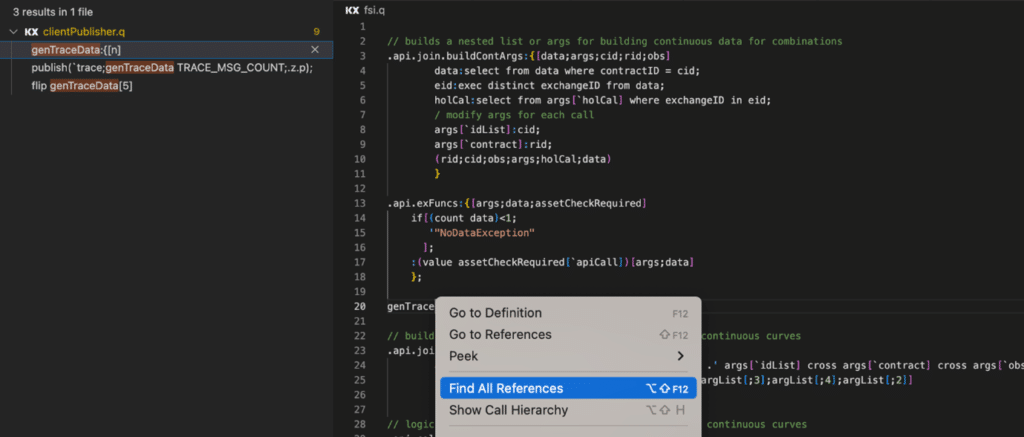
The plugin facilitates application development convenience in an extremely popular IDE used widely by developers, data scientists and data engineers. It can be used with kdb+, including its Personal Edition, kdb Insights, including its Personal Edition for writing, running and exploring query results in q. Both are extended by a version for kdb Insights Enterprise that uses a shared kdb process to add data sources, create data pipelines and interact with API endpoints.
Please visit the Visual Studio marketplace for more detailed information on the functionality of the kdb VS Code plug-in, an installation guide and a Q&A.
By Steve Wilcockson
If you’re reading this, you likely want to add speed and performance to your Python code and notebooks while also reducing time from research to production.
In our whitepaper Accelerate Your Python Development Journey With PyKX, we’ve compiled a series of use cases, technical examples, and some “Getting Started” guides to introduce PyKX and how it provides interoperability between Python and kdb.
Having spent 25 years with quants, data scientists, and, more recently, data engineers, architects, and CTOs, I’ve seen Python emerge from a fringe functional language into a functional language powerhouse, driving data science and AI forward. I witnessed its rise in the late 2000s, and now work for an organization that embraces its culture and helps Python achieve new things in production big data analytics.
Python from the Other Side
I joined KX in May 2022. Prior to this I’d worked with two technologies strongly impacted by the rising tide of Python.
For many years, I worked with MATLAB, which, between 2010 and 2015, was the language of data science before Python (and arguably R) took over.
MATLAB is the language that Geoffrey Hinton used to explore neural nets (I had the pleasure of speaking with a university secretary when he needed an academic license). And Andrew Ng based his first online data science course around it. In fact, numerous other greats of the industry built their neural nets models and developed machine learning and statistical functionality with MATLAB.
I then worked with Java, the most popular language of the enterprise and in computer science education, until Python took over, in popularity terms at least.
I specifically note November 2020 when the influential Tiobe Index placed Python above Java for the first time, a trajectory that has not (yet) reverted. When I speak with practitioners, I increasingly hear phrases like “We no longer teach Java in our Computer Science course; we’re using Python primarily,” “Java is for us a legacy, albeit a useful one, but the new stuff is primarily Python,” and “Docker and Kubernetes changed everything – Java is no longer required, and I can more easily take languages like Python into cloud and microservices environments.”
It was tough to take because I was loyal to the languages I served – MATLAB and then Java – but I really loved Python’s focus on open source and community. On one hand, Python was simple. I give you some code, and you run it in your Python IDE or notebook. You didn’t have to “buy” a license for something.
But there was much more besides. If the community wanted something, it built it. Indeed, the reason I believe Python took off was because a chap called Wes Mckinney developed Pandas in 2008.
Pandas is essentially a data management and analysis application that wraps up low-level mathematical optimizations and operations of key Python package NumPy into simple data transformations, joins, aggregations, and analyses.
In short, Pandas made Python usable for everyday numerical applications, which happened to include big statistical calculations. Pretty soon, if not overnight, those who were from a world where “My professors taught me MATLAB during my master’s degree” were now in a situation where they could say: “So I studied 76,948 Python code repositories to teach myself Python.”
Python: The Language of Data Science
That key bit of functionality Wes McKinney developed gave coders a great technical reason, beyond “it’s free,” to build statistical, time-series, and machine-learning applications in Python. It changed the game.
What happened next? Well, Pandas invigorated the development and application of scikit-learn, the key machine-learning package in the Python ecosystem. In the meantime, Big Tech built and open-sourced deep learning code bases, for example, Facebook with PyTorch, Google with Tensorflow, Berkeley with Caffe.
For those familiar with OpenAI and LLaMa, PyTorch is the training giant on which LLM giants stand.
Thus, Python is now the language of Generative AI implementation, which is only natural as it’s been the language of data science, machine, and deep learning for 10 to 15 years.
But there’s a massive catch in the story I just told.
Python is the front-end, the thing people see and interact with. It’s a hub for data sets, running and sharing understandable code, often as Notebooks. The glue that binds the user experience together – allowing rapid, simple, reproducible prototyping and data science.
However, those deep learning libraries were mostly implemented in C++ or C. The predominant big and fast data platforms – those that stuck the course like Spark, Kafka, and Snowflake – were implemented, if not in C++, then in Java. The ecosystem that gives Python wings is commonly not Pythonic, but Python beautifully front-ends it.
Python: The Culture of Data Science
But Python is more than just a programming front-end, for standalone notebooks or extensive code bases powered by, and integrating with, a multitude of other technologies. It’s a vibrant culture, a global community, a Zen, a way of life.
Why KX?
So why PyKX? From a practitioner level, PyKX is a data and analytics technology that interoperates Python with KX production data management and analytics to give Python wings.
It’s supremely powerful, providing orders of magnitude greater efficiency and performance than Python and Pandas for key tasks, meaning it’s possible to take the best bits of both for something production-worthy sooner.
Pandas and KX are built from the same foundational mathematical and computational constructs. The two technologies naturally align.
Incidentally, going back to my MATLAB days, while Python became the time series, matrix algebra, and vector processing tool of choice for research, in the sector where I operated (financial services), KX rapidly grew to be the same in production. I was squeezed on both sides! And I loved it! And the two environments work together.
From a cultural perspective too, KX is an organization that gets open source. I work with committed Pythonistas, which I love. They live the open-source mentality and participate in the Python communities, often alongside KX users who are open-source aficionados.
And that culture matters.
Read the whitepaper to learn how the technologies of Python and KX help accelerate performance, improve efficiency, and significantly reduce time to production.
To learn more about KX technologies, vector databases and time series analytics, sign up to your local Vectorize World Tour Community Meetup.
by Neil Kanungo and Steve Wilcockson
This week, KX made KDB.AI Cloud generally available, a vector database for real-time contextual AI, that enhances Natural Language Processing and Generative AI search applications with relevancy at scale.
Read the KX announcement: KX Announces KDB.AI Cloud: The Free, Smarter Vector Database for AI.
Unique among vector databases, KDB.AI Cloud enables developers to bring temporal and semantic context and relevancy to their AI-powered application. KDB.AI Cloud works seamlessly with popular LLMs and machine learning workflows and tools, including LangChain and ChatGPT, while native support for Python and RESTful APIs means developers can perform common operations like data ingestion, search, and analytics using their preferred applications and languages.
Sign up for free for our Starter Edition. Within minutes, you’ll be performing contextual search with time-based and semantic relevancy.
Follow examples, with code, at the KDB.AI Learning hub.
Also on the KDB.AI Learning hub, explore industry use cases for practical applications:
Follow the articles for backgrounders and information
Start Building Contextual Apps With Real-Time Data today!
by Steve Wilcockson
Ferenc Bodon, Head of Benchmarking at KX, recently posted an interesting LinkedIn blog regarding research he conducted on simultaneous execution of functions across multiple kdb+ processes.
The work stemmed from an analysis of the speed and scalability profile of coordinating multiple workers from a central controller in storage efficiency tests using the KX Nano performance tool.
The analysis looked at two different methods for coordinating the worker processes: one using inter-process communications and one using file operations. For the former, he looked at a number of different approaches using each and peach functions for managing process coordination over multiple connections. Variations included using async flush to address blocking, broadcasts to reduce message serialization cost and a timer for coordinating simultaneous starts. For the file-based approach, Linux’s inotify function was used.
Analysis of results over multiple runs shows that timer-based approach delivers the best and most consistent results. It should be noted, however, that the optimal trigger offset depends on the hardware and network environment it’s running in.
The peach handlers approach, which manages the synchronous connections automatically, offered comparable performance but carries the overhead of dual operation (and maintenance) on both the controller and the worker processes. The peach one-shot approach, which manages available connections asynchronously, offers an expedient balance between the two, delivering speed and resilience without the overhead of complex configuration, implementation and maintenance.
By Steve Wilcockson
AI has had many false dawns, but we are far removed from early days of “fuzzy logic.”
With the recent explosion of generative AI, AI is clearly evolving from a sideline research curiosity into an exciting core business imperative. The Gartner “Applying AI — A Framework for the Enterprise”, illustrated below, outlines how enterprises should approach their AI initiatives:
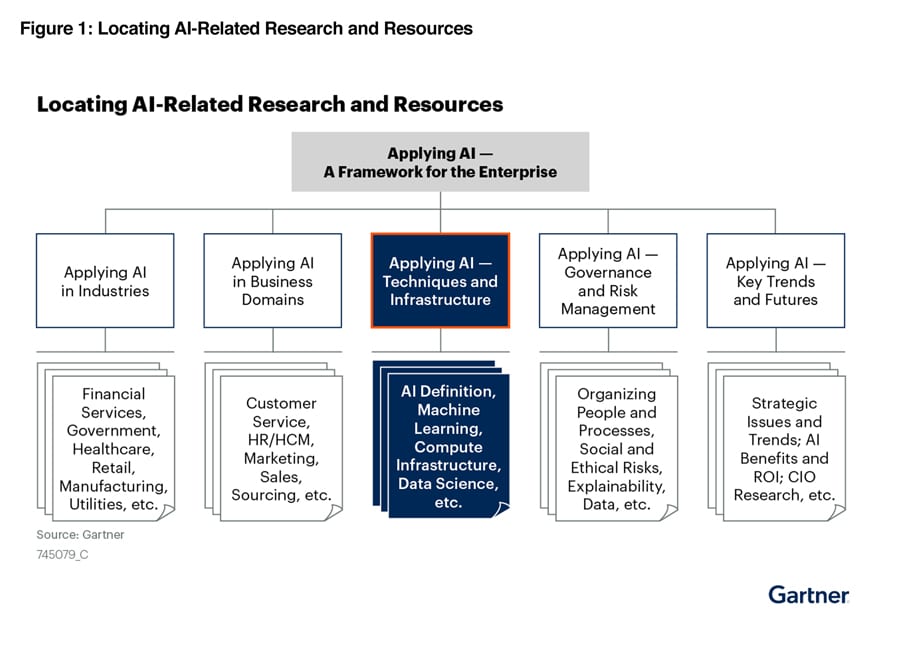
In outlining the fundamental techniques and practices for implementing AI within the enterprise, the report states, “IT leaders struggle to implement AI within AI applications, wasting time and money on AI projects that are never put in production.”
Organizations want simplicity and flexible tools for more tasks and use cases, from research to production. At KX, we help to “squish your stack” and get more data science applications into production sooner. Here’s how:
AI Simulation
Decades into the lifespans of digital transformation, there is little “low hanging fruit” left. Efficiencies are harder to find, anomalies harder to spot, and decisions involve more people, from Subject Matter Experts to IT Teams, CTOs, and FinOps teams.
Simulation and synthetic data have always been important. From scenario stress testing to digital-twin modelling, results are inferred from simulations over swathes of historical and synthetically generated data – KX does this 100x faster at a 10th of the cost of other infrastructures. Common simulation case studies include:
Data Science
Your investment in AI infrastructure is wasted if data scientists cannot explore data and models easily and flexibly. With KX, tooling is driven from SQL and Python, data, and modelling languages of choice.
AI Engineering
As AI goes mainstream, enterprise features and guardrails are needed to ensure stability, robustness, and security. For governance, cataloguing and security, kdb integrates with tools of choice to share data and AI insights throughout the enterprise safely, securely and with speed.
Compute Infrastructure
AI consumes very Big Data. That, unfortunately, means huge storage and compute requirements. With KX, storage and compute efficiencies mean cost savings and lower environmental overheads.
Generative AI
With AI no longer simply discriminative or code-queried, but also generative and prompt-queried, KDB.AI has been built to apply what’s a given for GenAI workflows with greater efficiency, and augment with direct raw vector processing power. Sample use cases range from more accurate fraud detection and insightful risk management to automated financial analysis and improved regulatory compliance – all harnessing real time information, and particularly temporal data, for improved decision making.
Gartner, Applying AI — Techniques and Infrastructure, Chirag Dekate, Bern Elliot, 25 April 2023. GARTNER is a registered trademark and service mark of Gartner, Inc. and/or its affiliates in the U.S. and internationally and is used herein with permission. All rights reserved.
By Conor McCarthy
The KX machine learning team has an ongoing project of periodically releasing useful machine learning libraries and notebooks for kdb+. These libraries and notebooks act as a foundation to our users, allowing them to use the ideas presented and the code provided to access the exciting world of machine learning with KX.
This release, which is the second in a series of releases in 2019, relates to the areas of cross-validation and standardized code distribution procedures for incorporating both Python and q distribution. Such procedures are used in feature creation through the FRESH algorithm and cross-validation within kdb+/q.
The toolkit is available in its entirety on the KX GitHub with supporting documentation on the Machine Learning Toolkit page of the KX Developers’ site.
As with all the libraries released from the KX machine learning team, the machine learning Toolkit (ML-Toolkit) and its constituent sections are available as open source, Apache 2 software.
The primary purpose of this library is to provide kdb+/q users with access to commonly-used machine learning functions for preprocessing data, extracting features and scoring results.
This latest release expands on the scoring and feature extraction aspects of the toolkit, by introducing two new areas of functionality and improving functions contained in the machine learning toolkit:
Cross-validation is used to gain a statistical understanding of how well a machine learning model generalizes to independent datasets. This is important in limiting overfitting and selection bias, especially when dealing with small datasets. A variety of methods exist for cross-validation, with the following implemented in this release:
All of the aforementioned methods have been implemented in kdb+/q and are documented fully on code.kx.com here. For each of these methods, a grid search procedure has also been implemented allowing users to find the best set of hyperparameters to use with a specific machine learning algorithm.
The roll-forward and chain-forward methods have particular relevance to time-series data. These methods maintain a strict order where the training sets precede the validation sets, ensuring that future observations are not used in constructing a forecast model. A graphical representation of each is provided below.
Roll-forward cross-validation
This method tests the validity of a model over time with equisized training and testing sets, while enforcing that the model only test on future data.
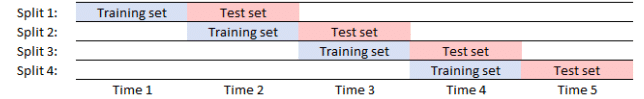
Image 1. Roll-forward validation
Chain-forward cross-validation
This method tests the ability of a model to generalize when retrained on increasingly larger volumes of data. It provides insight into how the accuracy of predictions is affected when expanding volumes of training data are used.
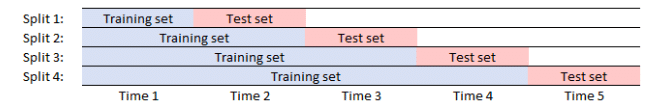
Image 2. Chain-forward validation
Full documentation on the cross-validation functions can be found here.
A framework has been developed to transparently distribute jobs to worker processes in kdb+/q. This framework supports distribution of both Python and q code, this has been incorporated into the FRESH and cross-validation libraries and is also available as a standalone library. Distribution works as follows:
$ q ml/ml.q -s -4 -p 1234.ml.mproc.init[abs system"s"]enlist".ml.loadfile`:fresh/init.q"Which results in the following architecture

Within the toolkit, work involving both the FRESH and cross-validation procedures will be automatically peached if the console has been started with a defined number of worker processes and main port. The procedures can be initialized by running either of the following:
FRESH process
q)\l ml/ml.q            // initialize ml.q on the console
q).ml.loadfile`:fresh/init.q           // initialize fresh
Cross-Validation process
q)\l ml/ml.q            // initialize ml.q on the console
q).ml.loadfile`:xval/init.q           // initialize cross-validation
While general purpose in nature, this framework is particularly important when distributing Python.
The primary difficulty with Python distribution surrounds Python’s use of a Global Interpreter Lock (GIL). This limits the execution of Python bytecode to one thread at a time, thus making distributing Python more complex than its q counterpart. We can subvert this by either wrapping the Python functionality within a q lambda or by converting the Python functionality to a byte stream using Python ‘pickle’ and passing these to the worker processes for execution. Both of these options are possible within the framework outlined here.
If you would like to further investigate the uses of the machine learning toolkit, check out the machine learning toolkit on the KX GitHub to find the complete list of the functions that are available in the toolkit. You can also use Anaconda to integrate into your Python installation to set up your machine learning environment, or you build your own which consists of downloading kdb+, embedPy and JupyterQ. You can find the installation steps here.
Please do not hesitate to contact ai@kx.com if you have any suggestions or queries.
AMERICAS
Tel: +1 (212) 447 6700
EMEA
Tel: +44 (0)28 3025 2242
APAC
Tel: +65 65921960
ANZ
Tel: +61 (0)2 9236 5700


