

Key Takeaways
- KX Dashboards AI Builder lets users create and edit dashboards from natural language prompts without requiring knowledge of KX Dashboards or kdb+/q.
- The AI Builder generates complete dashboard definitions by combining user prompts with schema metadata, column descriptions, and dashboard-generation rules.
- KX Dashboards never sends underlying data to the AI provider—only table schemas, column metadata, and administrator-defined descriptions are shared.
- Well-documented schemas significantly improve dashboard quality because the AI Builder relies on metadata to understand business meaning and generate accurate dashboards.
- KX Dashboards AI Builder enables business users to build dashboards faster while allowing technical teams to focus on governance, data modelling, and reviewing generated dashboards.
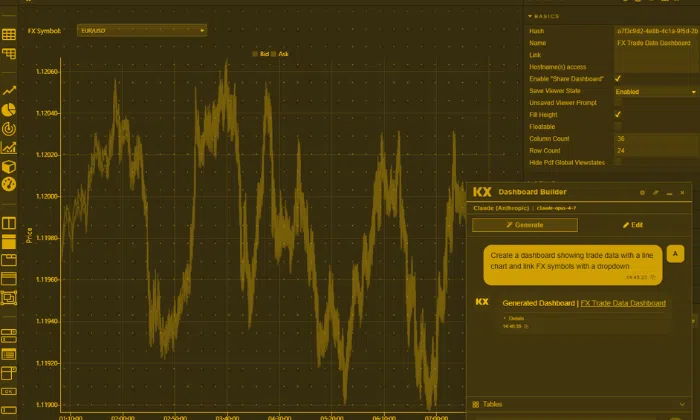
The latest version of KX Dashboards (2.22) includes the KX Dashboards AI Builder, a feature that creates and edits dashboards from plain-language prompts, no knowledge of the Dashboards component model or kdb+/q required. A user simply describes the dashboard they want, from something as simple as a single chart to something as involved as a multi-component, linked dashboard. KX Dashboards sends that prompt, along with data source metadata, column descriptions, and dashboard-generation rules, to the configured AI provider. The provider returns a JSON dashboard definition, which KX Dashboards loads into the application. No rows or values from the underlying data are ever sent, only the schema metadata.
That gives users a faster, lower-barrier way to move from idea to working dashboard. Previously, building a dashboard, even a simple one, meant knowing which components to use, how to bind them to a data source, and how to write the underlying query. The AI Builder removes that requirement:
- Simple requests, such as “show me a line chart of trade volume,” produce a working single-component dashboard in one prompt.
- More complex requests, such as “show me trade data with a line chart, a data grid filtered by desk, and a currency dropdown linked to both,” are resolved the same way, with the AI Builder handling the component selection, bindings, and linking logic that would otherwise take real dashboarding and query knowledge to set up manually.
- Iteration happens the same way generation does: describe the change in plain language, and refine the dashboard without going back to a developer.
This matters most for the people who couldn’t previously build a dashboard at all: someone who understands their data but has never used KX Dashboards, or doesn’t know kdb+/q, can now go from a plain-language description to a working dashboard, simple or complex, without needing to learn either first. It also changes where technical teams put their time: natural language generation absorbs the routine setup work, freeing technical teams to focus on schema quality, governance, and reviewing generated output.
How KX Dashboards AI Builder Works
KX Dashboards AI Builder turns a natural language request into the same kind of dashboard definition a user could build manually. Here’s what that looks like in practice, starting with the prompt itself.
A user might enter a prompt such as:
Create a dashboard showing trade data with a line chart and link FX symbols with a dropdown.The user can also specify a target table. That helps the AI Builder focus the generated dashboard on the intended data source.
At a high level, the flow is:
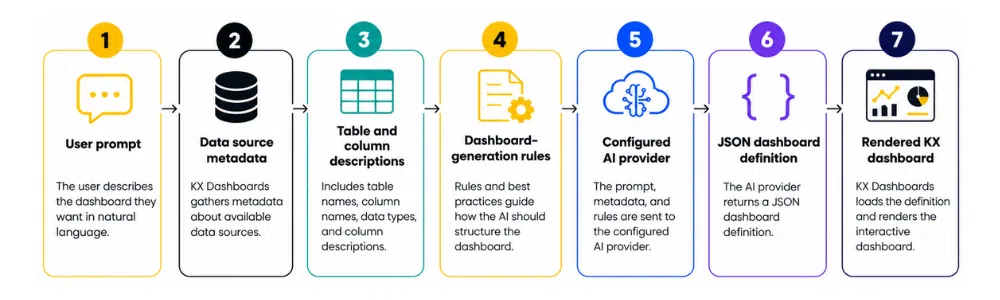
The prompt gives the AI Builder the user’s intent. The schema metadata gives it the context needed to turn that intent into dashboard components, bindings, queries, and interactions.
What Changes Compared With Manual Dashboard Building
KX Dashboards AI Builder changes the first-draft dashboard workflow. Building a KX dashboard manually means placing components, connecting them to data sources, setting field bindings, and adjusting properties. A trade blotter dashboard might need a Data Grid, a Financial Chart, and a Dropdown List that filters both views: each of those three components needs its own configuration, plus the query logic behind the binding. That’s a workflow that assumes familiarity with the component model, the data source setup, and, for anything beyond a default binding, how to express the right kdb+/q query.
The AI Builder replaces that first step. A user describes the intended dashboard and gets a generated starting point, with components placed, bound, and linked, instead of building it piece by piece. Editing works the same way: open an existing dashboard, describe the change, and let the AI Builder update the dashboard definition directly.
For example:
Add a dropdown to filter by currency and link it to the existing chart.What that one sentence replaces, done manually, is: adding a Dropdown List component, populating its values from the currency column, adding a filter action, binding that action to the existing chart’s data source, and testing that the link behaves as expected. The AI Builder resolves all of that from the description.
For new users
For someone with no dashboard-building experience, this is the difference between not being able to build a dashboard at all and being able to produce one immediately. There’s no need to learn what a Data Grid or Financial Chart component is, how bindings work, or how to write a query against the underlying table: the prompt is the only interface that matters. A new user can go from “I need to see trade data with a currency filter” to a working dashboard without first learning KX Dashboards or kdb+/q.
This also changes how new users iterate. Traditionally, a new user hitting a wall would need to ask someone else to make the change, or spend time learning the tool to make it themselves. With the AI Builder, refining a dashboard is the same skill as creating it: describe the change, in plain language, and it’s applied.
For experienced developers and data engineers
For someone who already knows the component model and could build the trade blotter dashboard by hand, the AI Builder’s value is removing repetition. Component placement, binding, and basic query construction are mechanical steps once you know how to do them; the AI Builder does that mechanical work in seconds, leaving the developer to focus on what the manual process doesn’t do well anyway: reviewing the result, tuning the layout, handling edge cases, and deciding whether the generated structure is the right long-term pattern.
It also changes what “iteration” costs. An experienced developer can prototype several dashboard variants quickly by prompt, testing which layout or chart type actually communicates the data best, before committing time to hand-building the final version. That’s a faster design loop than manually rebuilding each variant to compare them.
The net effect across skill levels
- Business users and new users get direct access to dashboard creation without needing to learn the tool first.
- Data engineers and BI specialists get their routine setup work absorbed, freeing time to focus on governance and on reviewing dashboards built by users who wouldn’t otherwise be able to build one at all.
Why Schema Descriptions Improve Dashboard Quality
KX Dashboards AI Builder uses schema metadata to understand the available data. That metadata includes table names, column names, data types, and free-text descriptions. Those descriptions help the AI Builder understand what each field means and how it should be used in a dashboard.
The AI Builder relies on the table and column descriptions configured in Global Properties to translate a plain-language prompt into the correct components, bindings, and query. Without meaningful descriptions, it’s working from names alone. Names are often ambiguous or too terse to convey intent, unit, or usage.
Important: The AI Builder never sees client data
The AI provider only ever receives the schema metadata: table names, column names, types, and the descriptions an administrator has written, not the underlying data itself. No rows, values, or query results are sent to the AI provider. This is what makes the accuracy of these descriptions so important: the AI Builder’s entire understanding of what the data means comes from the metadata it’s given, not from inspecting the actual data.
A generic description gives the AI Builder limited context:
{
  "name": "value",
  "type": "float",
  "description": "Numeric measure."
}
A specific description gives the AI Builder clearer direction:
{
  "name": "value",
  "type": "float",
  "description": "Trade notional in USD. Use as the y-axis measure for trade blotter charts."
}
The second version identifies the business meaning, unit, and likely visualization role. That helps the AI Builder connect a user’s prompt to the right field.
For technical teams, schema documentation becomes part of the value of the AI Builder. Clear table names and column descriptions improve every generated dashboard that uses that schema. The better the metadata, the better the AI Builder can translate natural language into useful dashboard components.
What Administrators Need to Set Up
An administrator sets up KX Dashboards AI Builder in Global Properties under the NLX tab. Setup includes selecting an AI provider and model, adding an API key, and defining the table schemas and column descriptions the AI Builder can use.
Those settings apply across users once saved. That makes the setup reusable: define the AI provider and schema context once, and users can start generating dashboards from natural language prompts.
The product documentation covers the detailed configuration steps. For blog readers, the key point is that the AI Builder combines natural language input with governed schema metadata, giving teams a practical route from prompt to dashboard.
What KX Dashboards AI Builder Enables
KX Dashboards AI Builder helps teams move from dashboard request to working draft faster.
| Area | What It Enables |
|---|---|
| Faster first drafts | Users can generate a working dashboard from a prompt instead of setting up each component manually |
| Easier iteration | Users can describe changes to an open dashboard and refine the layout through conversation |
| Broader self-service | Users who do not know every component or query pattern can still create a useful starting point |
| Better use of technical time | Data teams can spend more time on schema quality, reusable patterns, and review |
| Shared data context | Schema descriptions give users and the AI Builder a common language for dashboard generation |
| Flexible AI setup | Administrators can configure the provider, model, and schema context for their environment |
When to Use the KX Dashboards AI Builder
The AI Builder exists to shorten the distance between needing a dashboard and having a working one, without requiring someone to learn the KX Dashboards component model or know how to write a kdb+/q query first.
Get people building dashboards faster
Traditionally, building a dashboard means knowing which components to use, how to bind them to a data source, and, for anything beyond the basics, how the underlying query needs to be written. That’s a real barrier for anyone outside the technical team.
The AI Builder removes that barrier for a wide range of common requests:
- No dashboard-building knowledge required. A user can describe the outcome they want, such as a line chart of trade data filterable by currency, and get a working dashboard without knowing how to place a component, set a binding, or navigate the workspace.
- No kdb+/q knowledge required. The AI Builder generates the underlying query from the schema metadata and column descriptions configured by an administrator. The user never needs to write, read, or understand qSQL to get a correct result.
- Iteration without going back to a developer. Once a dashboard exists, further changes, such as adding a filter, changing a chart type, or resizing a grid, are also a plain-language description, so a non-technical user can refine their own dashboard rather than filing a request and waiting.
This is the main use case worth designing the rollout around: enabling people who could not previously build or query a dashboard at all to do so themselves, immediately.
Where it applies best
- New or occasional users who need a dashboard now and don’t have time to learn the tool.
- Business users who understand their data and what they want to see, but not how KX Dashboards or kdb+ works.
- Fast iteration on an existing dashboard, without a round trip to whoever built it.
- Any environment with well-described schemas: the clearer the table and column descriptions, the more reliably a plain-language request turns into a correct dashboard, which matters more for users who have no way to independently judge whether a query is right.
Conclusion
KX Dashboards can create and edit dashboards using natural language. KX Dashboards AI Builder turns a prompt into a dashboard definition by combining user intent with schema metadata and dashboard-generation rules.
For users, the AI Builder means a faster way to create a working dashboard draft. For administrators and data teams, it creates a clear setup path: define the AI provider, document the schema, and give the AI Builder the context it needs to generate useful dashboards.
A strong rollout starts with well-described data. When the schema is clear, natural language dashboard generation becomes a practical way for more users to create and refine dashboards in KX Dashboards.
Explore the KX Dashboards AI Builder documentation
Frequently Asked Questions
Can KX Dashboards create dashboards from natural language?
Yes. KX Dashboards AI Builder can create and edit dashboards from plain-language descriptions.
How does KX Dashboards AI Builder work?
KX Dashboards sends the user’s prompt, data source metadata, column descriptions, and dashboard-generation rules to the configured AI provider. The provider returns a JSON dashboard definition that KX Dashboards loads into the application.
What does KX Dashboards AI Builder create?
KX Dashboards AI Builder creates a JSON dashboard definition that KX Dashboards can render as a dashboard.
Who sets up KX Dashboards AI Builder?
An administrator sets it up in Global Properties under the NLX tab. Setup includes selecting an AI provider and model, adding an API key, and defining table schemas.
Why do schema descriptions matter?
Schema descriptions give KX Dashboards AI Builder the context it needs to connect a user’s prompt to the right tables, columns, and dashboard components.