kdb Insights

Get started with kdb Insights 1.10

The kdb Insights portfolio brings the small but mighty kdb+ engine to customers wanting to perform real-time analysis of streaming and historical data. Available as either an SDK (Software Development Kit) or fully integrated analytics platform it helps users make intelligent decisions in some of the world’s most demanding data environments.

In our latest update, kdb Insights 1.10, KX have introduced a selection of new features designed to simplify system administration and resource consumption.

Let’s explore.

New Features

Working with joins in SQL2: You can now combine multiple tables/dictionaries natively within the kdb Insights query architecture using joins, including INNER, LEFT, RIGHT, FULL, and CROSS.

Learn how to work with joins in SQL2

Implementing standardized auditing: To enhance system security and event accountability, standardized auditing has been introduced. This feature ensures every action is tracked and recorded.

Learn how to implement auditing in kdb Insights

Inject environment variables into packages: Administrators can now inject environment variables into both the database and pipelines at runtime.. Variables can be set globally or per component and are applicable for custom analytics through global settings.

Learn more about packages in kdb Insights

kxi-python now supports publish, query and execution of custom APIs: The Python interface, kxi-python has been extended to allow for publishing and now supports the execution of custom APIs against deployment. This significantly improves efficiency and streamlines workflows.

Learn how to publish, query and execute custom APIs with kxi-python

Publishing to Reliable Transport (RT) using the CLI: Developers can now use kxi-python to publish ad-hoc messages to the Insights database via Reliable Transport. This ensures reliable streaming of messages and replaces legacy tick architectures used in traditional kdb+ applications.

Learn how to publish to Reliable Transport via the CLI

Offsetting subscriptions in Reliable Transport (RT): We’ve introduced the ability for streams to specify offsets within Reliable Transport. This feature reduces consumption and enhances operational efficiency. Alternative Topologies also reduce ingress bandwidth by up to a third.

Learn how to offset streams with Reliable Transport

Monitoring schema conversion progress: Data engineers and developers now have visibility into the schema conversion process. This feature is especially useful for larger data sets, which typically require a considerable time to convert.

Learn how to monitor schema conversion progress

Utalizing getMeta descriptions: getMeta descriptions now include natural language descriptions of tables and columns, enabling users to attach and retrieve detailed descriptions of database structures.

Learn how to utilize getMeta descriptions

Feature Improvements

In addition to these new features, our engineering teams have been busy working to improve existing components. For example: –

  • We’ve optimized getData for queries that span multiple partitions.
  • We’ve introduced REST filtering for time, minute, and time span fields
  • We’ve introduced End of Interval Memory Optimization to automatically clear large, splayed tables
  • We’ve updated the Service Gateway to support JSON responses over HTTP
  • We’ve introduced customizable polling frequency in File Watcher
  • We’ve updated the Stream Processor Kafka writer to support advanced configuration
  • We’ve introduced a “Max Rows” option in views to limit values returned
  • We’ve enabled the ability to query by selected columns in the UI Screen to reduce payload.

To find out more, visit our latest release notes then get started by exploring our free trial options.

Benchmark Report – High Frequency Data Benchmarking

Three Innovative Quant Trading Apps and Three Ideas Everyone Should Steal

Structure, meet serendipity: Integrating structured and unstructured data for left- and right-brain decisions

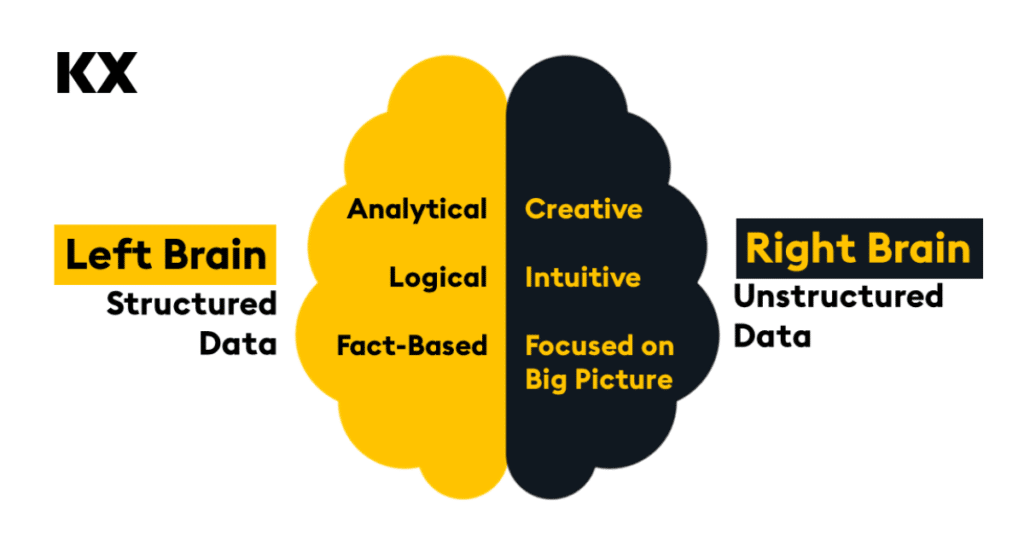
Most technologists view using unstructured data (conversations, text, images, video) and LLMs as a surging wave of technology capabilities. But the truth is, it’s more than that: unstructured data adds an element of surprise and serendipity to using data. It decouples left—and right-brain thinking to improve insight generation and decision-making. 

A recent MIT study points to the possibility of elevating analytics in this way. It observed 444 participants performing complex tasks associated with communicating key decisions like an analysis plan by a data scientist about how they plan to explore a dataset.  The study found that using GenAI increased speed by 44% and improved quality by 20%. The study shows that analysts, data scientists, and decision-makers of all kinds can use unstructured data and GenAI to elevate decision-making when they use unstructured and structured data. 

This form of data-fueled decision-making combines the unstructured data required to power right-brain, creative, intuitive, big-picture thinking—with structured data for left-brain analytical, logical, and fact-based insight to inform balanced decision-making. 

Here’s how it works. 

Diagram comparing Structured Data to Left-Brain thinking and Unstructured Data to Right Brain thinking

Unstructured data: A creative, intuitive, big-picture data copilot 

Unstructured data powers creative, intuitive, big-picture thinking. Documents and videos are used to tell stories on a stream of consciousness. In contrast to structured data, it’s designed to unfold ideas in a serendipitous flow – a journey from point A to point B, with arcs, turns, and shifts in context. 

Navigating unstructured data is similarly serendipitous. It matches how the brain processes fuzzy logic, relationships among ideas, and pattern-matching. The rise of LLMs and generative AI is largely because prompt-based exploration matches how our brains think about the world – you ask questions via prompts, and neural networks predict what might resolve your quandary.  Like your brain, neural networks help analyze the big picture, generate new ideas, and connect previously unconnected concepts. 

This creative, right-brain computing style is modeled after how our brains work. Warren Mcculloch and Walter Pitts published the seminal paper in 1943 that theorized how computers might mimic our creative brains in A Logical Calculus of the Ideas Immanent in Nervous Activity. In it, they described computing that casts a “net” around data that forms a pattern and sparks creative insight in the human brain. They wrote: 

“…Neural events and their relations can be treated using propositional logic. It is found that the behavior of every net can be described in these terms, with the addition of more complicated logical means for nets containing circles, and that for any logical expression satisfying certain conditions, one can find a net behaving in the fashion it describes.” 

Eighty years later, neural networks are the foundation of generative AI and machine learning. They create “nets” around data, similar to how humans pose questions. Like the neural pathways in our brain, GenAI uses unstructured data to match patterns.  

So, unstructured data provides a new frontier of data exploration, one that complements the creative “nets” that our brains cast naturally over data. But, alone, unstructured data is fuel for our creativity, and it, too, can benefit from some right-brain capabilities. From a data point of view, the right brain is informed by structured data.  

Structured data: An analytical, logical, fact-based copilot 

Structured data is digested, curated, and correct. The single source of the truth. Structured data is our human attempt to place the world in order and forms the foundation of analytical, logical, fact-based decision-making. 

Above all, it must be high-fidelity, clean, secure, and aligned carefully to corporate data structures. Born from the desire to track revenue, costs, and assets, structured data exists to provide an accurate view of physical objects (products, buildings, geography), transactions (purchases, customer interactions, conversations), and companies (employees, reporting hierarchy, distribution networks) and concepts (codes, regulations, and processes). For analytics, structured data is truth serum.  

But digested data loses its original fidelity, structure, and serendipity. Yes, structured data shows us that we sold 1,000 units of Widget X last week, but it can’t tell us why customers made those purchasing decisions. It’s not intended to speculate or predict what might happen next. Interpretation is entirely left to the human operator.  

By combining access to unstructured and structured data in one place, we gain a new way to combine both the left and right sides brain as we explore data. 

This demo explains how our vector database, KDB.AI, works with structured and unstructured data to find similar data across time and meaning, and extend the knowledge of Large Language Models.

Where unstructured exploration meets structured certainty, by example 

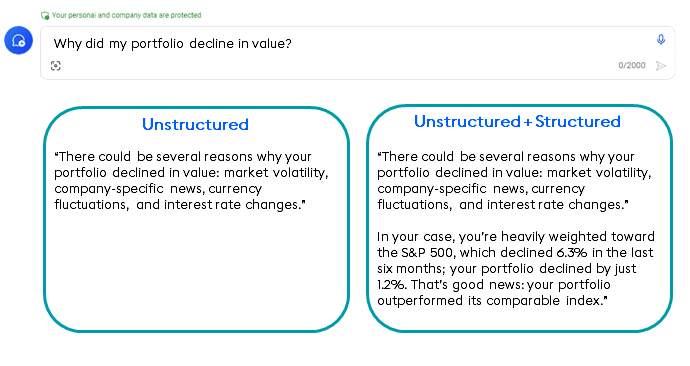
Combining structured and unstructured data marries accuracy with serendipitous discovery for daily judgments. For example, every investor wants to understand why they made or lost money. Generative AI can help answer that data in a generic way (below, left). When we ask unstructured data why our portfolio declined in value, AI uses unstructured data to provide a remarkably good human-based response: general market volatility, company-specific news, and currency fluctuations provide an expansive view of what might have made your portfolio decline in value.  

But the problem with unstructured-data-only answers is that they’re generic. Trained on a massive corpus of public data, they supply the most least-common-denominator, generic answers. What we really want to know is why our portfolio declined in value, not an expansive exploration of all the options. 

Fusing unstructured data from GenAI with structured data about our portfolios provides the ultimate answer.  GenAI, with prompt engineering, interjects the specifics of how your portfolio performed, why your performance varied, and how your choice compared to its comparable index.  

The combination of expansive and specific insight is shown in the right column, below: 

Bringing left-and-right brain thinking together in one technology backplane is a new, ideal analytical computing model. Creative, yet logical, questions can be asked and answered. 

But all of this is harder than it may sound for five reasons. 

How to build a bridge between unstructured and structured data 

Unstructured and structured data live on different technology islands: unstructured data on Document Island and structured data on Table Island. Until now, different algorithms, databases, and programming interfaces have been used to process each. Hybrid search builds a bridge between Document and Table Island to make left-and-right brain queries possible. 

Hybrid search requires five technical elements: 

  1. Hybrid data indexing  
  1. Hybrid query processing 
  1. High-frequency streaming data 
  1. Hybrid time series organization 
  1. Vector embedding-free storage optimization 

In our next post, we’ll explore these elements and how they build a bridge between creative and logical data-driven insights. Together, they form a new way of constructing an enterprise data backplane with an AI Factory approach to combine both data types in one hybrid context.  

The business possibilities of combining left-and-right brain analytics are as fundamental as the shift in how decision-making works in the context of AI. So, introduce new thinking methods based on new hybrid data technology capabilities for elevated data exploration and decision-making. 

Learn how to integrate unstructured and structured data to build scalable Generative AI applications with contextual search at our KDB.AI Learning Hub.

KX for Databricks

Seven Innovative Trading Apps and Seven Best Practices You Can Steal

Quant Trading Data Management by the Numbers

11 Insights to Help Quants Break Through Data and Analytics Barriers

Book a Demo

Amazon FinSpace with Managed kdb Insights

The Montauk Diaries – Two Stars Collide

by Steve Wilcockson


Two Stars Collide: Thursday at KX CON [23]


My favorite line that drew audible gasps at the opening day at the packed KX CON [23]

“I don’t work in q, but beautiful beautiful Python” said Erin Stanton of Virtu Financial simply and eloquently. As the q devotees in the audience chuckled, she qualified her statement further “I’m a data scientist. I love Python.”

The q devotees had their moments later however when Pierre Kovalev of the KX Core Team Developer didn’t show Powerpoint, but 14 rounds of q, interactively swapping characters in his code on the fly to demonstrate key language concepts. The audience lapped up the q show, it was brilliant.

Before I return to how Python and kdb/q stars collide, I’ll note the many announcements during the day, which are covered elsewhere and to which I may return in a later blog. They include:

Also, Kevin Webster of Columbia University and Imperial College highlighted the critical role of kdb in price impact work. He referenced many of my favorite price impact academics, many hailing from the great Capital Fund Management (CFM).

Yet the compelling theme throughout Thursday at KX CON [23] was the remarkable blend of the dedicated, hyper-efficient kdb/q and data science creativity offered up by Python.

Erin’s Story

For me, Erin Stanton’s story was absolutely compelling. Her team at broker Virtu Financial had converted a few years back what seemed to be largely static, formulaic SQL applications into meaningful research applications. The new generation of apps was built with Python, kdb behind the scenes serving up clean, consistent data efficiently and quickly.

“For me as a data scientist, a Python app was like Xmas morning. But the secret sauce was kdb underneath. I want clean data for my Python, and I did not have that problem any more. One example, I had a SQL report that took 8 hours. It takes 5 minutes in Python and kdb.”

The Virtu story shows Python/kdb interoperability. Python allows them to express analytics, most notably machine learning models (random forests had more mentions in 30 minutes than I’ve heard in a year working at KX, which was an utter delight! I’ve missed them). Her team could apply their models to data sets amounting to 75k orders a day, in one case 6 million orders over a 4 months data period, an unusual time horizon but one which covered differing market volatilities for training and key feature extraction. They could specify different, shorter time horizons, apply different decision metrics. ”I never have problems pulling the data.” The result: feature engineering for machine learning models that drives better prediction and greater client value. With this, Virtu Financial have been able to “provide machine learning as a service to the buyside… We give them a feature engineering model set relevant to their situation!,” driven by Python, data served up by kdb.

The Highest Frequency Hedge Fund Story

I won’t name the second speaker, but let’s just say they’re leaders on the high-tech algorithmic buy-side. They want Python to exhibit q-level performance. That way, their technical teams can use Python-grade utilities that can deliver real-time event processing and a wealth of analytics. For them, 80 to 100 nodes could process a breathtaking trillion+ events per day, serviced by a sizeable set of Python-led computational engines.

Overcoming the perceived hurdle of expressive yet challenging q at the hedge fund, PyKX bridges Python to the power of kdb/q. Their traders, quant researchers and software engineers could embed kdb+ capabilities to deliver very acceptable performance for the majority of their (interconnected, graph-node implemented) Python-led use cases. With no need for C++ plug-ins, Python controls the program flow. Behind-the-scenes, the process of conversion between NumPy, pandas, arrow and kdb objects is abstracted away.

This is a really powerful use case from a leader in its field, showing how kdb can be embedded directly into Python applications for real-time, ultra-fast analytics and processing.

Alex’s Story

Alex Donohoe of TD Securities took another angle for his exploration of Python & kdb. For one thing, he worked with over-the-counter products (FX and fixed income primarily) which meant “very dirty data compared to equities.” However, the primary impact was to explore how Python and kdb could drive successful collaboration across his teams, from data scientists and engineers to domain experts, sales teams and IT teams.

Alex’s personal story was fascinating. As a physics graduate, he’d reluctantly picked up kdb in a former life, “can’t I just take this data and stick it somewhere else, e.g., MATLAB?”

He stuck with kdb.

“I grew to love it, the cleanliness of the [q] language,” “very elegant for joins” On joining TD, he was forced to go without and worked with Pandas, but he built his ecosystem in such a way that he could integrate with kdb at a later date, which he and his team indeed did. His journey therefore had gone from “not really liking kdb very much at all to really enjoying it, to missing it”, appreciating its ability to handle difficult maths efficiently, for example “you  do need a lot of compute to look at flow toxicity.” He learnt that Python could offer interesting signals out of the box including non high-frequency signals, was great for plumbing, yet kdb remained unsurpassed for its number crunching.

Having finally introduced kdb to TD, he’s careful to promote it well and wisely. “I want more kdb so I choose to reduce the barriers to entry.” His teams mostly start with Python, but they move into kdb as the problems hit the kdb sweet spot.

On his kdb and Python journey, he noted some interesting, perhaps surprising, findings. “Python data explorers are not good. I can’t see timestamps. I have to copy & paste to Excel, painfully. Frictions add up quickly.”  He felt “kdb data inspection was much better.” From a Java perspective too, he looks forward to mimicking the developmental capabilities of Java when able to use kdb in VS Code.”

Overall, he loved that data engineers, quants and electronic traders could leverage Python, but draw on his kdb developers to further support them. Downstream risk, compliance and sales teams could also more easily derive meaningful insights more quickly, particularly important as they became more data aware wanting to serve themselves.

Thursday at KX CON [23]

The first day of KX CON [23] was brilliant. a great swathe of great announcements, and superb presentations. For me, the highlight was the different stories of how when Python and kdb stars align, magic happens, while the q devotees saw some brilliant q code.

Kdb Insights Personal Edition License Download