
Developer
Stop the Data Tax With Managed Market Data

Less data prep. More modelling.
Download our ebook to uncover how OneTick Market Data reduces the data preparation and maintenance overhead that slows quant research.
ポイント
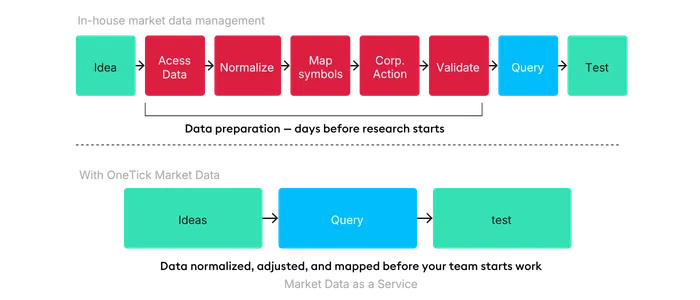
- The delay between an idea and a backtest often starts before research begins. Access, identifiers, corporate actions, timestamps, joins, and validation all have to be right before you can trust the result.
- Raw market data pushes you into low-leverage work. The time you should spend testing signal gets spent fixing data.
- Building a research-ready tick data environment can take 24–51 weeks and more than $150K before the first production-grade workflow is ready.
- OneTick Market Data and OneTick Cloud give you a managed, query-ready environment for backtesting, TCA, microstructure analysis, and signal generation.
- You can access market data through Python, SQL, REST, WebAPI, CSV/Parquet bulk extraction, and Pandas DataFrames, with 30+ years of tick history across 250+ venues.
You were hired to find signal.
To pressure-test ideas, build models, run backtests and help decide which hypotheses deserve more capital.
Instead, you’re spending too much of that time as a data janitor.
A simple equity-history pull can derail the day. The ticker changed after a corporate action in 2019. One table uses the old identifier. Another uses the new one. The query still returns a result, but the join is wrong.
The backtest shows a 75% price crash that never happened.
Now the backtest that should have run on Monday runs on Wednesday. Two other hypotheses wait behind it.
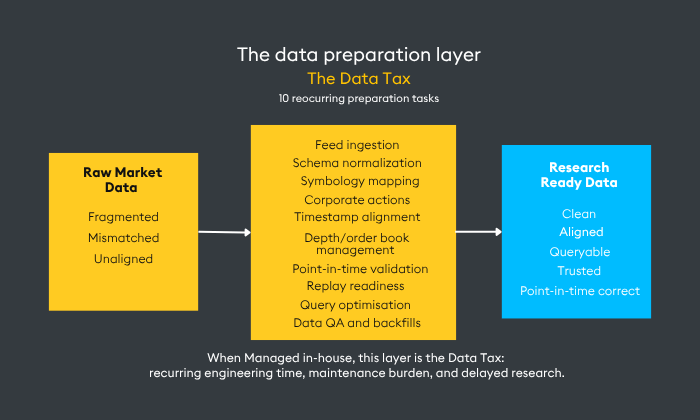
Where the Data Tax shows up
That delay is the Data Tax: the recurring preparation work you are stuck doing between market data and usable research.
Your firm may already have vendor contracts, storage, engineers and internal data platforms. You still need the data in the right shape before you can trust a backtest.
Historical tick data has to be loaded. Corporate actions have to be applied and checked. Symbols have to be mapped across vendors and venues. Permissions have to be managed. Bars, quotes and consolidated market views have to be generated. The platform has to stay current as feeds, schemas and asset coverage change.
Each new market, venue or asset class adds another cycle.
In a multi-manager platform, different pods can end up cleaning the same data in different ways. In an asset manager, a new market can take weeks to become testable. In a broker-dealer, engineering time goes into maintaining data systems while analytics and execution projects wait.
Some firms need to keep parts of this stack in-house. That choice comes with ongoing maintenance. The research team should be clear on how much of that work sits between an idea and a result.
The cost of preparing market data
We estimate that a self-managed tick data environment can take 24–51 weeks and more than $150K before the first production-grade workflow is ready. That includes feed onboarding, history loading, corporate action logic, symbol cross-reference, bar and quote generation, consolidated market views, storage, compute, permissioning, monitoring, and support.
The cost is not only engineering time. It is the research time lost while the environment is still being prepared.
| Cost area | What has to happen | What it costs the research team |
|---|---|---|
| Data onboarding | Source, permission, ingest and validate each feed or historical dataset. | New research ideas wait until the data is available and trusted. |
| Symbology and reference data | Map identifiers across venues, vendors and internal systems. Maintain changes over time. | Joins break, histories split and researchers spend time reconciling instruments. |
| Corporate actions | Apply splits, dividends, symbol changes and other events across historical data. | Backtests can show false price moves or train on the wrong version of history. |
| Timestamp alignment | Align events across feeds, venues, time zones and data sources. | Models and execution analysis can use market context in the wrong order. |
| Bars, quotes and market views | Generate bars, quotes, depth views and consolidated liquidity views. | Teams rebuild common analytics inputs before they can test the actual idea. |
| Point-in-time validation | Check that the dataset reflects what was known at the time of the decision. | Research can introduce look-ahead bias without the team noticing. |
| Replay readiness | Store and structure history so order book state and market conditions can be reconstructed. | Microstructure, TCA and intraday signal research take longer to set up. |
| Infrastructure maintenance | Maintain storage, compute, permissions, monitoring, feed changes and query performance. | Quants and engineers spend time keeping the environment usable instead of improving research output. |
The cost shows up in missed research cycles.
If 70 to 80% of your week goes into cleaning, mapping and aligning market data, the firm gets fewer tested ideas from the same research team. A signal that could have been rejected on Tuesday may still be waiting for clean inputs on Friday.
The build cost matters. The delay matters more.
How OneTick Market Data reduces the Data Tax
OneTick Market Data reduces the preparation work between hypothesis and test.
You start with prepared market data. Corporate actions, reference data, symbology, continuous futures definitions, bar and quote generation, and consolidated market views are handled before the data reaches your workflow.
You can query 30+ years of tick history across 250+ venues through Python, SQL, REST or WebAPI. You can pull bulk data as CSV or Parquet, or work with results in Pandas DataFrames.
The first step is the query.
Symbol cross-referencing is handled before you start reconciling identifiers manually. You can query a current symbol and retrieve the relevant historical record across identifier changes, including mappings across Bloomberg, ICE, SEDOL, CUSIP, FIGI, and ISIN.
That matters when the research depends on continuity. If you query META, the environment can return the relevant Facebook history without forcing you to rebuild that mapping by hand.
What changes for your research
Backtesting and strategy research
Backtesting depends on clean history, corporate-action-adjusted prices, consistent symbology and point-in-time fidelity.
A model trained on the wrong version of history can learn from events it could not have known at the time. A model tested on unadjusted prices can react to moves that only exist in the dataset.
With OneTick Market Data, you start with cleaner history and consistent identifiers, so more of your time goes into testing the hypothesis.
TCA and best execution
TCA needs trades and fills joined to market data across fragmented venues.
Slippage, venue performance and implementation shortfall only mean something when the market context is right. With OneTick Market Data, you can join execution data to normalized market data and analyze performance without rebuilding that context from raw feeds.
Market microstructure and signal generation
Microstructure research needs depth-of-book data, replay-ready history and compute for burst workloads.
If you are studying order-book dynamics or intraday signals, you need to replay market conditions, test behavior across venues and run heavier workloads when the research demands it. OneTick Market Data gives you prepared data and the deployment choices to support that work.
How it fits your environment
OneTick Market Data gives you the prepared data layer: normalized, mapped, adjusted, validated and ready to query.
The deployment model can match how your team works. You can start in OneTick Cloud when speed to first query matters. You can deploy through OneTick Platform in your own cloud or on-premise environment when control, data residency or internal architecture requirements matter. You can extend the same prepared data into KDB-X when you need more control over time-series analytics, AI workloads or production-scale applications.
That means the starting point can be a research sandbox, a managed cloud environment, your own infrastructure or a deeper KDB-X deployment. The core benefit stays the same: your team starts with market data that is ready for research.
| Requirement | In-house build | OneTick Market Data and OneTick Cloud |
|---|---|---|
| Time to first production-grade workflow | 24–51 weeks | Days to weeks from onboarding |
| Upfront cost | >$150K before research begins | No capital build required |
| Ongoing maintenance | Permanent internal function | Handled externally |
| Market and asset-class expansion | New onboarding cycle per market, venue, or asset class | Faster expansion through the managed environment |
| Compute for peak load | Infrastructure sized for peak load | Elastic capacity for burst workloads |
| Symbology and corporate actions | Maintained internally | Prepared before delivery |
| Point-in-time controls | Designed and validated internally | Maintained within the environment |
| Research access | Built and supported internally | Python, SQL, REST, WebAPI, CSV/Parquet, and Pandas DataFrames |
From data repair to research output
Clean data is basic to good research. You should not have to start every promising idea by fixing the data underneath it.
OneTick Market Data changes the starting point. You begin with normalized, hydrated, query-ready data, then move into backtesting, TCA, market microstructure analysis and signal generation in the environment that fits your team.
.Start a free trial and query sample market data in minutes, or book a demo with a OneTick expert.
Stop the Data Tax With Managed Market Data
Less data prep. More modelling.
Download our ebook to uncover how OneTick Market Data reduces the data preparation and maintenance overhead that slows quant research.