We are all encouraged to be problem solvers. Solutions, however, depend not only on the complexity of the problem but also on the skillset of the solver and the tools at their disposal. Moreover, some can be faced head-on whereas others are best addressed indirectly. If, for example, you want to decide if a coin is fair you have two options. You could go through the arduous process of measuring it, scanning it and aerodynamically profiling it. Or, you could just flip it loads of times and see if it ends up being roughly 50/50 heads or tails.
This empirical technique is sometimes referred to as Monte Carlo simulation. It has its origins in the Manhattan project for developing the atomic bomb but is now used widely in finance, industry and science for solving complex problems ranging from options pricing to predictive analytics. Its downside is that it is both data and computationally intensive. Its upside though is its broad applicability. Take this interesting example.
Imagine you are in a game show with three doors in front of you. Behind one of them are the keys to a new car and behind each of the other two is a goat. You can choose any door to win what’s behind it. After you make your choice the game host then opens one of two remaining doors to reveal a goat. Now you are given another option: stick with your first choice or switch to the remaining door. Which would you do if you really wanted that car?
Most people’s response is that it doesn’t matter: there are two doors, behind one is a car and behind the other is a goat, so you have 50/50 chance either way.
The surprising answer is that you should switch. It’s counterintuitive and caused much controversy when the puzzle was first published in The American Statistician in 1975 but, as mentioned above, there are a number of ways to approach it.
One is using conditional logic:
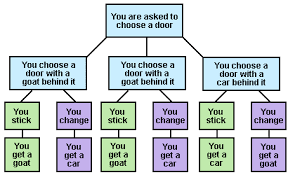
Convinced? Probably not. It might be a solution but it’s hardly compelling, so it’s easy to see why there was controversy at the time. Below is a much more intuitive explanation as outlined in Mark Haddon’s book “The curious incident of the dog in the night-time”
The diagram shows that by switching (in purple) you get the car two out of three times, whereas by sticking (in green) you get the car just one out of three times.
But even that didn’t convince everyone. Some, including Paul Erdos, a famous mathematician, wanted to approach it in an even more intuitive way – by trying it many times and observing the results, i.e. via Monte Carlo simulation. As that would involve generating and processing large amounts of data it seemed like an ideal candidate for kdb+ to determine if switching really is the best option.
The only problem was there wasn’t a programmer around.
Starting Simply
So the only option was to download the 32bit version of kdb+ from kx.com and, armed with just the tutorials and reference material on code.kx.com, dive into the surprisingly inviting world of q. The installation was quick, the console was simple, the introductory instructions were clear and in no time lists of random numbers were being created, added and compared in ways that would be needed for running a simulation. Equally importantly, the feedback was immediate as the interpreted nature of q meant there was no messy compiling or linking required, so it could be seen instantly where mistakes were being made. It also gave an insight into why it must be so quick for real coders to develop and debug applications.
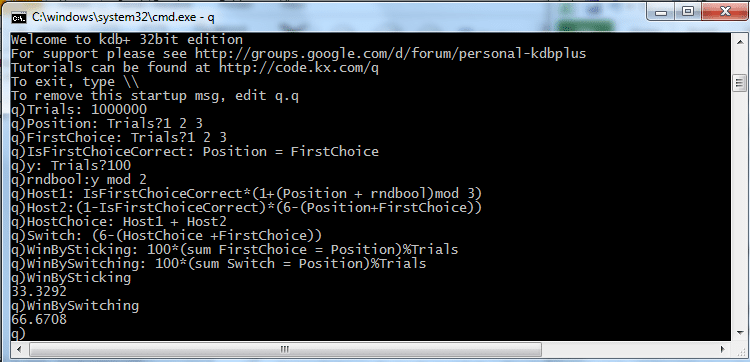
Sometime later the following was arrived at.
Trials: 1000000
Position: Trials?1 2 3
FirstChoice: Trials?1 2 3
IsFirstChoiceCorrect: Position = FirstChoice
y: Trials?100
rndbool:y mod 2
Host1: IsFirstChoiceCorrect*(1+(Position + rndbool)mod 3)
Host2:(1-IsFirstChoiceCorrect)*(6-(Position+FirstChoice))
HostChoice: Host1 + Host2
Switch: (6-(HostChoice +FirstChoice))
WinBySticking: 100*(sum FirstChoice = Position)%Trials
WinBySwitching: 100*(sum Switch = Position)%Trials
WinBySticking
WinBySwitching
When it was run, it gave the following output:
So, by looking at the last four lines, it could be seen from trying it a million times that there is 33% chance of winning the car by sticking with the first choice and a 67% chance of winning it by switching.
And that’s how to avoid a goat in Monte Carlo.
As surprising as the result itself was that with just the very basic, self-taught, rudiments of kdb+ it was possible for a non-programmer to run a simulation so quickly. Moreover, its simplicity contrasted greatly with a similar attempt using Excel that required, literally, a million rows and lots of manipulation, parsing and selecting of data. But what about elegance?
Becoming Elegant
Kdb+ is known for its simplicity and elegance. While the exercise above may have pointed to its simplicity much more interesting was to consider how an experienced programmer might approach the problem and how succinct and elegant a solution could be made using the more advanced features of q.
Have a look!
Trials:1000000;
tab:([] Position:Trials?1 2 3;Choice:Trials?1 2 3);
update Correct_Position=Choice from `tab;
WinBySticking:exec 100*(sum Correct)%Trials from `tab;
update Choice:0N from `tab where Correct;
update Choice:Position from `tab where not Correct;
WinBySwitching:exec 100*(sum Position=Choice)%Trials from `tab;
(WinBySticking;WinBySwitching)
Now that’s elegant!
From 14 lines to 8. More importantly, however, was that memory usage and runtime were reduced by 50%. This was achieved by combining some calculations, eliminating others and streamlining the rest. Also, using a table to hold the data and qsql to query it made the efficiency attainable without sacrificing code readability.
The real elegance, however, was in generalizing beyond a 3-door problem which, ironically, makes the solution all the clearer. Imagine there were 1,000 doors to start with. After you make your initial choice (which has only a 1/1000 chance of being right) the host must painstakingly open 998 of the remaining doors in order to leave you with just one other to choose from. At that point, you might be more likely to suspect that the unselected door conceals the car. In fact, there is a 99.9% chance it does – it’s just harder to see with all those goats running around. Change “Trials? 1 2 3” to “Trials?1+til 1000” in the 2nd line to see for yourself.
Vectorized operations proved themselves to be very efficient in this example. Options for larger-scale Monte Carlo simulation include distributing processing across multiple cores, using GPUs or introducing Sobel sequences as a low-discrepancy alternative to uniformly distributed random numbers.
Conclusion
The blog was driven by simple curiosity around the so-called “Monty Hall” problem and its surprising solution that can be best understood by running a simulation rather than through arcane probabilities. Equally surprising was how easy it was to run such a simulation using kdb+ and q. Most insightful though was how such a complex, counterintuitive and numerically taxing problem could be so elegantly resolved in a few lines by an experienced q programmer harnessing the power of KX. It might have saved a lot of heated discussion and red faces had it been available back in 1975 when many conflicting views prevailed. Click here to read about the furore it caused at the time.
But at least you know now how to avoid a goat in Monte Carlo, elegantly.


