- Products
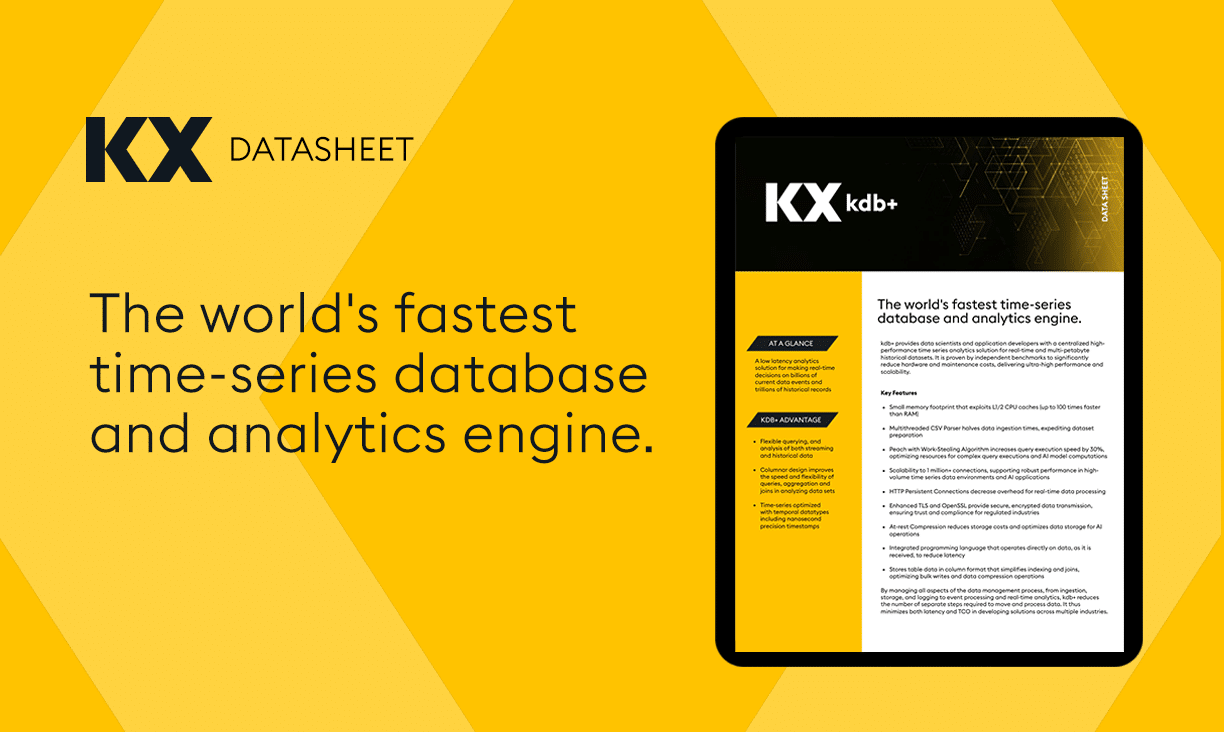
- kdb+
- kdb Insights
- KDB.AI
- Delta
- Sensors
- Market Partners
- Cloud Service
- AWS
- Azure
- Data Lake
- Snowflake
- Databricks
- Market Data
- ICE
- Services & Support
- Services
- Software Support
All Industries
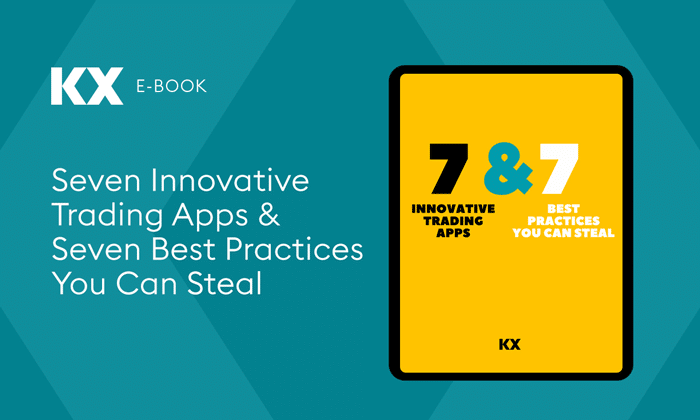
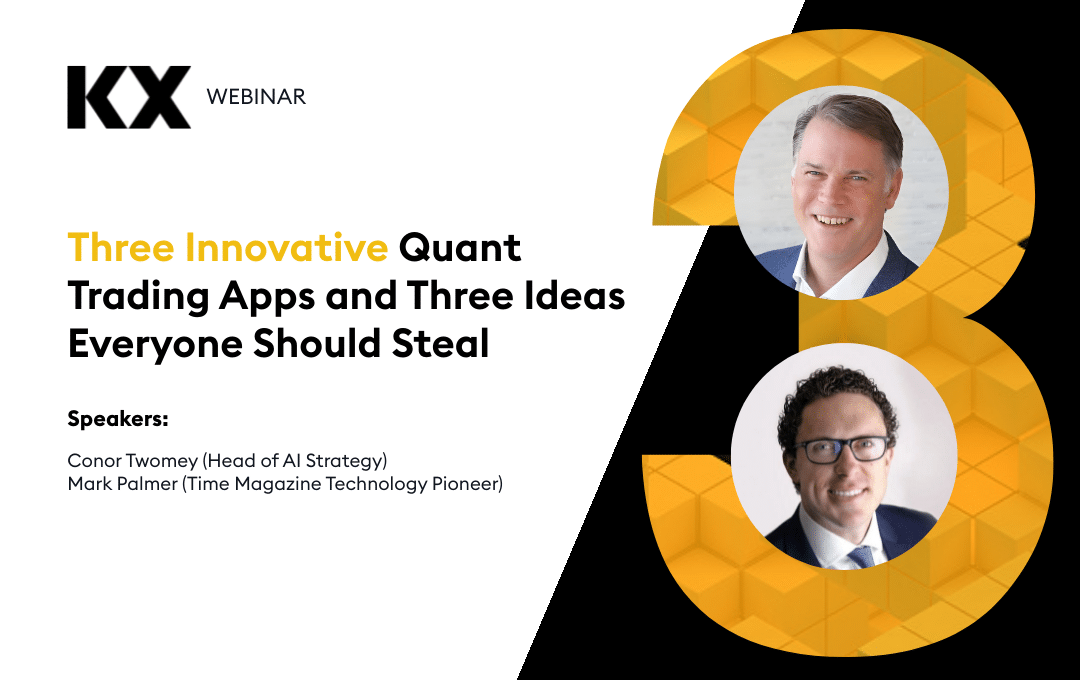
Seven Innovative Trading Apps and Seven Best Practices You Can Steal
Discover the secrets of the high-stakes world of capital markets, where trillions of events are processed daily, there’s no room for delay in our latest eBook.
All Industries
Quant Trading Data Management by the Numbers
Discover the future of data management in Wall Street with our new eBook and dive into the evolution of streaming analytics, time-series data management, and generative AI.
All Industries
Cultivate Sustainable Computing and Environmentally Responsible Analytics in an AI Age
Our new whitepaper identifies the escalation of AI demands and the new challenges they bring to boards, technology providers, and consumers.

- About Us
- Overview
- Partner with Us
- KX Partner Network
- Find a Partner
- Partner Signup
- Join Us
- Careers
- Connect with Us
- Contact Us
- Demo Request
All Industries
KX Launches KDB.AI Server Edition For Enterprise-Scale Generative AI
KX has announced the general availability of KDB.AI Server, a highly-performant, scalable, vector database for time-orientated generative AI and contextual search.