KDB-X Python
Introducing KDB-X Python
KX’s official Python interface. With KDB-X Python, you can:
- Develop with Python and kdb+ in the same workflow
- Use Python to build time-series databases and streaming applications
- Run queries, build APIs, and analyze data using in Python, SQL and kdb+
- Seamlessly work between KDB-X Python and other Python libraries such as Pandas, Numpy, PyArrow
- Visualize data insights natively with tools such as Plotly, Matplotlib and Seaborn
And it’s open source!
# Create an in-memory table
table = kx.Table(data = {
    'sym': kx.random.random(1000, ['AAPL', 'GOOG']),
    'price': kx.random.random(1000, 10.0),
    'volume': kx.random.random(1000, 1000)})

# Query this data
table.select(
    columns = kx.Column('price').max().name('max_price') &
              kx.Column('price').min().name('min_price') &
              kx.Column('price').wavg(kx.Column('volume')).name('vwap'),
    by = kx.Column('sym'))

# Add a date column
table.update(kx.Column('date', value = kx.DateAtom('today')), inplace=True)

# Reorder columns setting date as the first column
table.reorder_columns('date', inplace=True)# Generate a table with multiple days of data
table = kx.Table(data = {
'date': kx.DateAtom('today') - kx.random.random(10000, 5),
'sym': kx.random.random(10000, ['AAPL', 'GOOG']),
'price': kx.random.random(10000, 10.0),
'volume': kx.random.random(10000, 1000)})
# Create your on-disk database
db = kx.DB('database')
db.create(table, 'trades', 'date')
# Preview the table
db.trades
# Rename the 'sym' column as 'symbol'
db.rename_column('trades', 'sym', 'symbol')
# Multiply the value of the column 'volume' by 1000
db.apply_function('trades', 'volume', lambda x: 1000*x)# Generate a table with multiple days of data
table = kx.Table(data = {
'date': kx.DateAtom('today') - kx.random.random(10000, 5),
'sym': kx.random.random(10000, ['AAPL', 'GOOG']),
'price': kx.random.random(10000, 10.0),
'volume': kx.random.random(10000, 1000)})
# Access the first 10 rows
table[:10]
table.head(10)
# Sort the columns of the table in ascending order by price
table = table.sort_values('price')
# Calculate the max price by date and sym multiple ways
table.groupby(['date', 'sym'])['price'].max()
table.select(kx.Column('price').max(), by= kx.Column('date') & kx.Column('sym'))
# Calculate the correlation between the content of two columns
table.exec(kx.Column('price').correlation(kx.Column('volume')))
kx.q.cor(table['price'], table['volume'])New to KDB-X Python
We offer a wide range of training options, from self led to KX courses
Documentation
Explore our technical documentation for detailed guides, references and examples to unlock the full potential of KDB-X Python.
Releases
Keep up to date with the latest enhancements, new features, bug fixes and improvements.
KX Academy
Learn how to generate, analyze, and query large datasets using PyKX, focusing on data structures, tables, and time series analysis.


Integrate with KX products and our partners
We offer a wide range of training options, from self led to KX courses
kdb+
Build applications which embed machine learning and data science libraries into production q infrastructures.
Databricks
KX for Databricks leverages KDB-X Python directly inside Databricks, for Python and distributed Spark workloads.
KX Dashboards
Combine Python’s extensive libraries and functionalities with the high-performance capabilities of KX for data analysis, visualization, and interactive dashboard creation.
Snowflake
Use the power of PyKX to manage data and run time series analytics in Snowflake cloud.
VISUAL STUDIO CODE
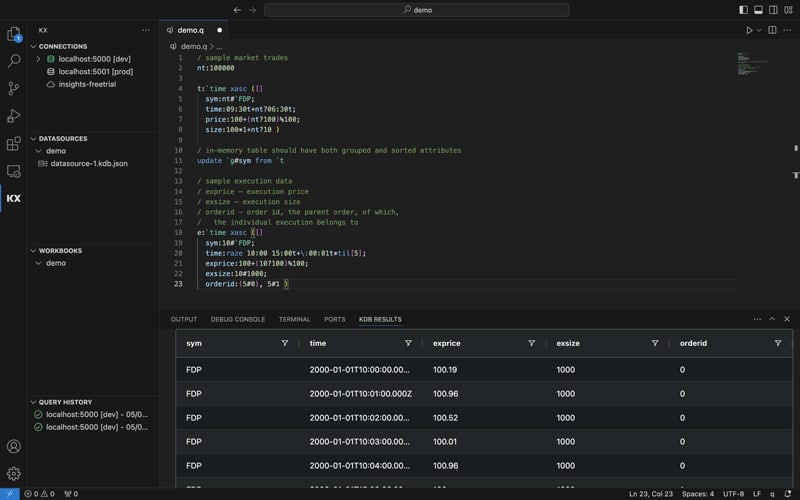
kdb VS Code extension
Enhance your development with the kdb+ VS Code extension, offering syntax highlighting, code snippets, and autocompletion for kdb+ queries. It provides an extensive set of features for creating and editing q files, connecting to multiple kdb processes, and executing queries, and is also compatible with kdb Insights Enterprise.
Download
Start building with the kdb VS Code extension
Can’t wait to get started? Here are some helpful resources.
Documentation
Explore the documentation to learn how to get started and to see examples of how to unlock the full potential of the extension.
Releases
Keep up to date with the latest enhancements, new features, bug fixes and improvements.
Download
Install the kdb+ VS Code extension for seamless integration, code assistance, and efficient management of kdb+ and Insights Enterprise queries and connections.
DASHBOARDS
Introducing KX Dashboards
Create dynamic and interactive visual analytics with KX Dashboards, designed to interpret complex data with ease. Build custom data visualizations, integrate seamlessly with kdb+ data sources, and gain actionable insights through user-friendly, real-time displays.
Download
Start building with KX Dashboards
Can’t wait to get started? Here are some helpful resources.
Documentation
Explore our technical documentation for detailed guides, references and examples to unlock the full potential of KX Dashboards.
Releases
Keep up to date with the latest enhancements, new features, bug fixes and improvements.
KX Academy
Learn how to create, query, and visualize data effectively. It’s ideal for beginners looking to enhance their skills in data visualization with kdb+ and comes with free hosted version of KX Dashboards for you to explore with.
Didn’t find what you’re looking for?
Ask our Community for help! Whether it’s surfacing existing content or creating new content for your needs, we’re on it!
Subscribe to our newsletter
Stay up-to-date on the latest product releases, integrations, tutorial guides, and events from KX.
「*」は必須フィールドを示します
By submitting this form, you will also receive sales and/or marketing communications on KX products, services, news and events. You can unsubscribe from receiving communications by visiting our Privacy Policy. You can find further information on how we collect and use your personal data in our Privacy Policy.
Follow us on social media


