
ポイント
- Enable seamless analytics across real-time and historical time-series data using a single engine.
- Modular components like microservices, REST APIs, and CI/CD-ready packaging empower developers to build, deploy, and manage custom analytics pipelines and applications.
- Built for modern DevOps environments, it supports containerized deployment and Kubernetes orchestration across AWS, GCP, and Azure.
Imagine building a real-time analytics platform that ingests, processes, and analyzes billions of events per day, without wrestling with a tangled web of open-source tools. No more late nights debugging Kafka-Spark-Redis pipelines. No more glue code. Just pure, high-performance streaming, all in one place.
In this blog, I will introduce kdb Insight SDK, a comprehensive solution that enables you to deploy, scale, and manage real-time data pipelines with a single, unified technology stack. We’ll explore its architecture, walk through a hands-on demo, and explore why it’s a game-changer for anyone building mission-critical, real-time applications.
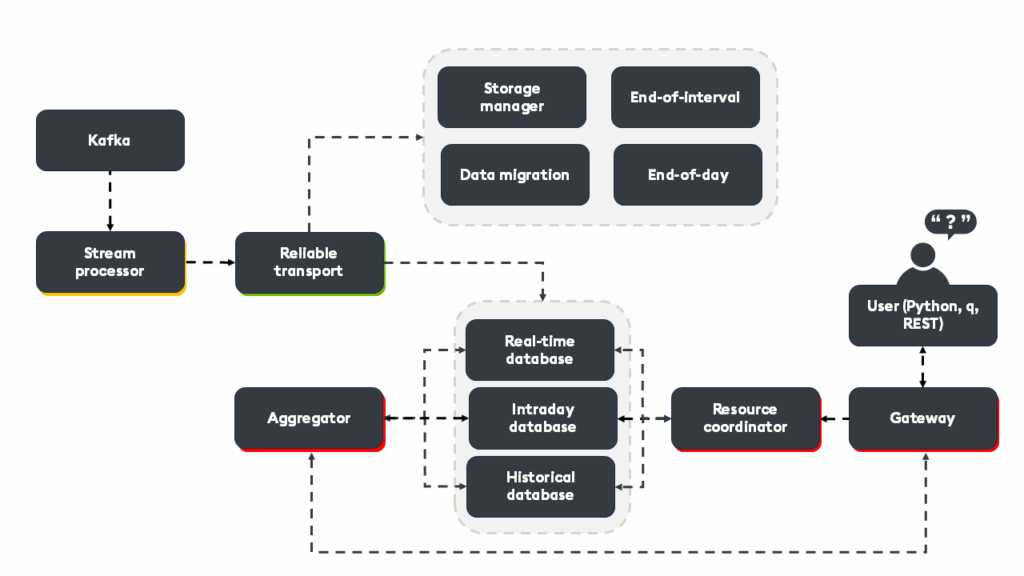
At the heart of kdb Insights SDK lies a modern, microservices-driven architecture designed to make real-time data engineering both powerful and approachable. Unlike traditional setups that require integrating a patchwork of open-source tools, kdb Insights SDK delivers a unified platform where every core capability is purpose-built and seamlessly connected.
Key components
Stream processor (SP)
The stream processor (SP) performs real-time ingestion of live data, often from sources like Kafka, REST APIs, or direct feeds, and applies high-speed transformations and analytics using the q language. It enables developers to perform complex computations, enrichments, or filtering to ensure only relevant, actionable data flows downstream.
Reliable transport and tickerplant
- Reliable transport (RT) provides a fault-tolerant messaging backbone and should be chosen when reliability, replay are critical. It utilizes consensus protocols (such as Raft) to ensure data delivery for slow or disconnected consumers
- kdb tickerplant (TP) (tick.q), offers ultra-low-latency for high-frequency environments that demand the absolute minimum latency. This should be used as an alternative to RT when you can manage failover and recovery yourself
Storage manager (SM)
The storage manager (SM) orchestrates the lifecycle of data, from hot in-memory storage to cold, cost-efficient archives. It ensures that real-time and historical data are always available, automatically managing data migration, compaction, and tiering. It manages the real-time database (RDB) which stores the most recent, real-time data in memory, the intra-day database (IDB) which acts as an intermediate, on-disk tier for recent data within the current day, and the historical database (HDB) which stores historical data, typically partitioned by date to disk or object storage for cost efficiency.
Data access process (DAP)
The data access process (DAP) provides a federated, read-only interface to all data, regardless of where it resides (RDB, IDB, HDB). Whether data is streaming in real time or archived on disk, DAP lets you access it through a unified API using q, SQL, or Python (via PyKX).
Service gateway (SG), resource coordinator (RC), and aggregator
- The service gateway (SG) acts as a single entry point for all client queries and API requests, routing them to the appropriate microservices
- The resource coordinator (RC) manages routing and orchestrates query execution by determining which DAPs are best suited to fulfill each request
- The aggregator collects and merges partial results from multiple DAPs into a single, unified response, enabling seamless federation of data across distributed sources
Typical workflow
- Data is ingested via the stream processor, which performs real-time transformations before passing to either the reliable transport or tickerplant for sequencing and delivery.
- The storage manager ensures that data is efficiently persisted and tiered for both immediate and long-term access.
- When a query or API request is made, the service gateway receives the request and collaborates with the resource coordinator to identify the relevant data access process.
- Each data access process processes its portion of the data before the aggregator merges the partial results into a single response for clients.
This architecture enables unified, high-performance access to both real-time and historical data, all orchestrated within a single tool without the integration complexities of traditional multi-tool stacks.
Example deployment
Let’s explore deploying, operating, and extending a real-time kdb Insights SDK architecture using the runbook-kdb-insights repository.
To begin, we will clone the repository and prepare the environment:
git clone https://github.com/RyanSieglerKX/runbook-kdb-insights.git
cd runbook-kdb-insights
mkdir -p data/db data/logs lic
chmod 777 -R data
We will also need to copy our free kdb license into the lic directory and configure the KXI CLI:
cp /path/to/k[4,c,x].lic lic/
# Edit ~/.insights/cli-config to:
[default]
usage = microservices
hostname = http://localhost:8080
Next, we will install KXI CLI and configure ‘~/.insights/cli-config’:
[default]
usage = microservices
hostname = http://localhost:8080
We need to ensure that Docker is installed and running with the WSL integration setting enabled. We also need to authenticate with the KX Docker registry:
docker login portal.dl.kx.com -u <user> -p <bearer token>If you would like to query and call APIs with q, we will also need to install kdb+/q:
export QHOME=~/q
export PATH=~/q/l64/:$PATH
Next, we will build the microservices stack, launching the core architecture configured in compose.yaml. This includes the reliable transport (RT), storage manager (SM), data access (DA), and supporting services:
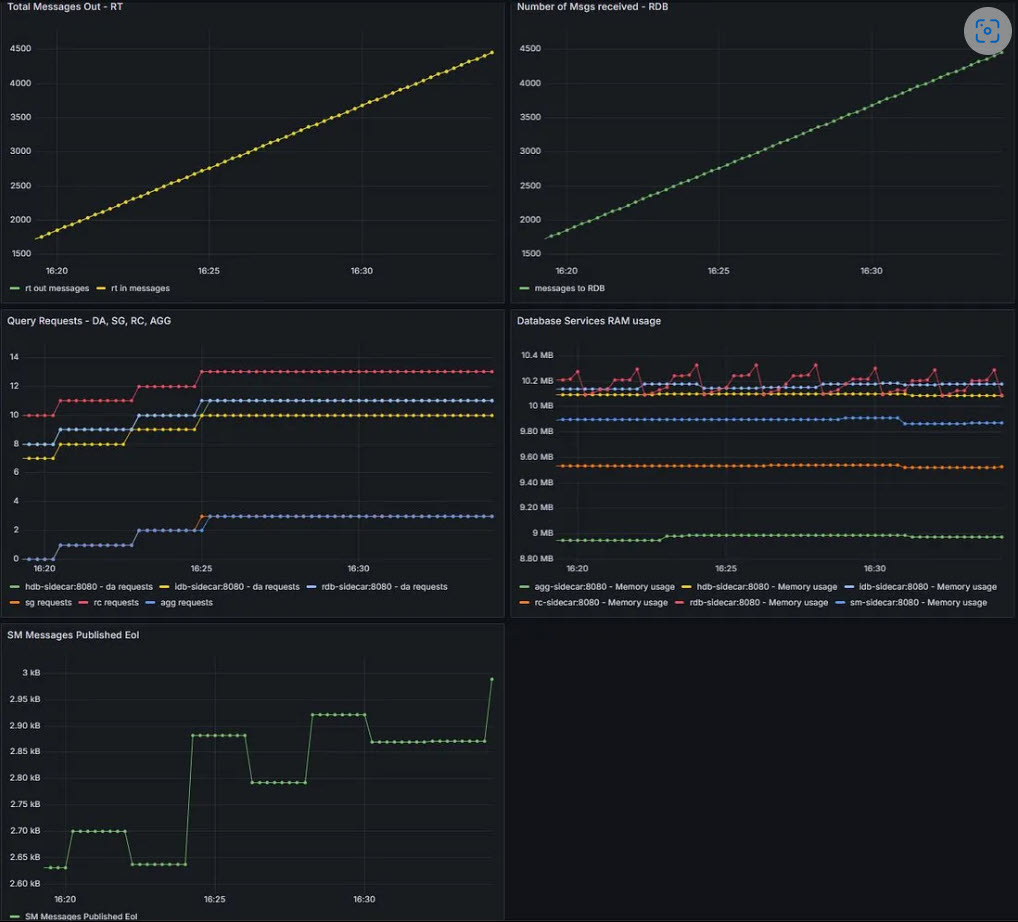
docker compose upWith our microservices installed, we can begin to visualize system health by monitoring with Grafana:
docker compose -f compose-metrics.yaml upBy opening localhost:3000 in a browser, we can view the Grafana dashboards, which will provide real-time visibility into throughput, latency, and resource usage:
Data ingestion
Once deployed, we can begin publishing data directly into the system using reliable transport (RT). In this instance, a simple CSV file named trade.csv:
kxi publish --mode rt --file-format csv --table trade --data config/trade.csv --endpoint :localhost:5002We can also begin a synthetic Kafka feed via the stream processor (SP), which will ingest sample trade and quote data and apply real-time q transformations before parsing to downstream services:
docker compose -f compose-stream.yaml upData query
Let’s now explore some basic querying. To begin, we will use SQL via the CLI:
kxi query --sql 'SELECT * FROM trade'
kxi query --sql 'SELECT count(*) FROM quote'
We can also query using q:
q) gw:hopen `:localhost:5050
q) gw(`.kxi.sql;enlist[`query]!enlist"SELECT * FROM trade WHERE (sym = 'AAPL')";`;(0#`)!())
One of the more powerful features is the ability to deploy custom analytics as microservices, exposing q functions as RESTful APIs.
There are two defined in the file ./custom/1.0.0/
The first, .example.daAPI: provides a simple function that multiplies a specified column in a given table:
curl -X POST http://localhost:8080/example/daAPI   -H 'Content-Type: application/json'   -d '{
    "table": "trade",
    "column": "price",
    "multiplier": 10
  }'
The second, .custom.aj performs an aj (as-of join) between the trades and quotes table for a given symbol:
curl -X POST http://localhost:8080/custom/aj   -H 'Content-Type: application/json'   -d '{
    "tradesTable": "trade",
    "quotesTable": "quote",
    "sym": "AAPL"
  }'
You can also call these APIs from q:
q) gw(`.custom.aj;(`tradesTable;`quotesTable;`sym)!(`trade;`quote;`AAPL);`;(0#`)!())Finally, we can view the real-time logs for each microservice:
docker compose logs -f kxi-rt    # Reliable Transport
docker compose logs -f kxi-sm    # Storage Manager
docker compose logs -f kxi-da    # Data Access
docker compose logs -f sp-worker # Stream Processor
System cleanup
docker compose down --remove-orphans
./RESET_DB.sh
kdb Insights SDK offers a range of advantages that distinguish it from traditional, multi-tool data stacks, particularly for teams developing real-time, high-performance analytics applications at scale. Built on the kdb+ engine, it delivers a single, integrated platform for ingesting, processing, storing, and querying time-series data with native support for languages including q, SQL, and Python.
The result is a faster time-to-market for new analytics applications, more reliable and actionable insights, and the agility to adapt as business requirements change, all while simplifying your data stack and reducing the total cost of ownership.
Learn more about kdb Insights SDK and read my other blogs on kx.com.