ポイント
- KDB-X provides advanced querying capabilities that allow users to perform complex analysis across both structured and unstructured data.
- Temporal Similarity Search detects patterns in time series data, allowing users to explore the narrative behind numerical trends.
- By combining vector-based text search with time series pattern detection, KDB-X supports sophisticated hypothesis testing.
Capital markets have always excelled at structured data analytics, but the most potent insights often lie hidden within vast pools of unstructured data. Structured data provides precision and speed, making it ideal for tasks such as quantitative modeling, risk management, and real-time trade execution. In contrast, unstructured data adds invaluable context, offering sentiment analysis, event-driven insights, and a deeper understanding of market drivers from news articles, analyst reports, earnings transcripts, and more.
In this tutorial, we will explore a real-world financial analysis scenario, using KDB-X to discover the relationship between corporate news announcements (unstructured text) and stock price movements (structured time series data). We will utilize SENS (Stock Exchange News Service) announcements from the Johannesburg Stock Exchange, along with corresponding market data obtained from Yahoo Finance.
If you would like to build this solution, you can do so by following the full tutorial on GitHub.
Let’s begin
Step 1: Data preparation and enrichment
To begin, we will load both structured market data and unstructured news announcements into KDB-X tables, ensuring that each announcement is made “queryable” by converting its body of text into numerical representations (vector embeddings). We will use a lightweight transformer model from Python’s sentence-transformers library, which we will call directly from within KDB-X, along with an embedding function to convert raw text into meaningful vectors.
/ Load the pre-trained transformer model using Python
model:ST[`$"paraphrase-MiniLM-L3-v2";`device pykw `cpu];

/ Define an 'embed' function that can be called from q
embed:{x[`:encode][y]`}[qmodel;];

/ Create embeddings for each announcement body
sens:update embedding:embed[`$body] from sens;
To make searching near instantaneous, we will load our embeddings into a Hierarchical Navigable Small World (HNSW) index, designed for fast similarity search.
Step 2: Explore the data
With the data prepared, we will now explore the relationship between the announcements and market performance from multiple angles.
Example: From text to trend
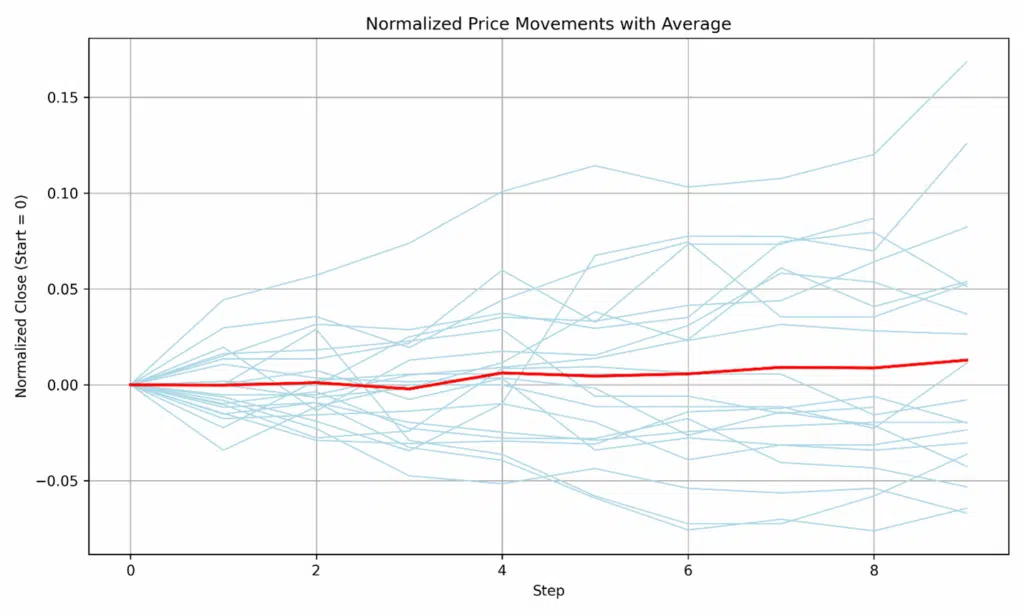
In our first example, we will search for a specific phrase within the news announcements, such as “interim results,” to determine if it serves as a leading indicator for market movements.
- We embed our search phrase into a vector.
- We use the HNSW index to find the 30 announcements most similar to our phrase.
- We then pull the stock performance for each of those companies for the 14 days following the announcement.
The results show that, on average, these announcements were followed by a 3.8% increase in stock price over the next 14 days.
Example: From trend to text
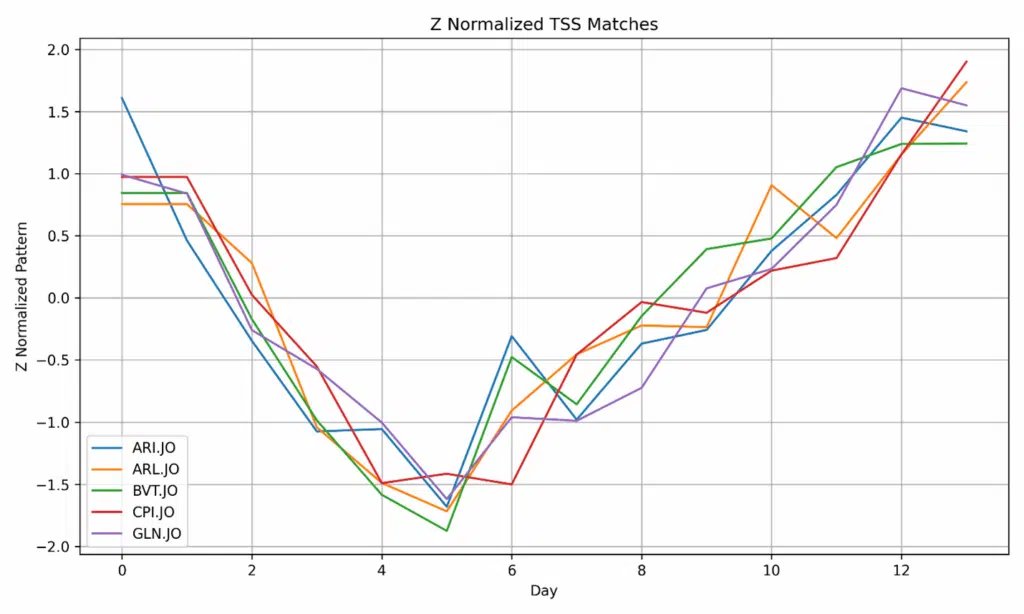
We can also reverse this process by highlighting a specific pattern in our structured data and the corresponding text to identify the cause. In this instance, a “V-shaped” dip and recovery, representing a five-day price fall followed by a ten-day recovery.
Using the KDB-X Temporal Similarity Search (TSS), we can identify stocks that followed this V-shaped pattern, revealing a clear theme and highlighting headlines such as “unaudited result” and “interim result”.
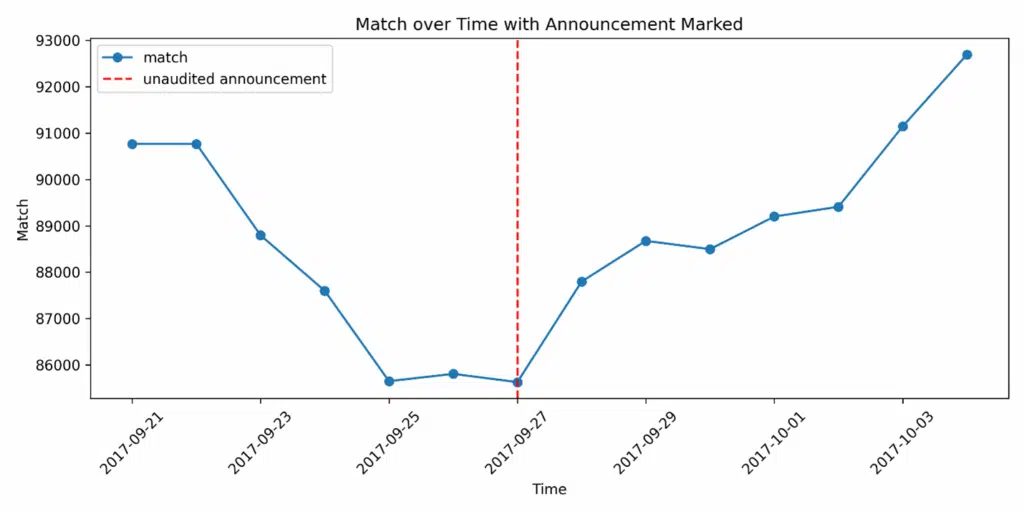
In one specific case, we find that a positive earnings announcement (“Headline earnings per share up 17%”) was released at the bottom of the price dip, immediately preceding the recovery, demonstrating a clear correlation between the news event and market activity.
Example: Combined searches
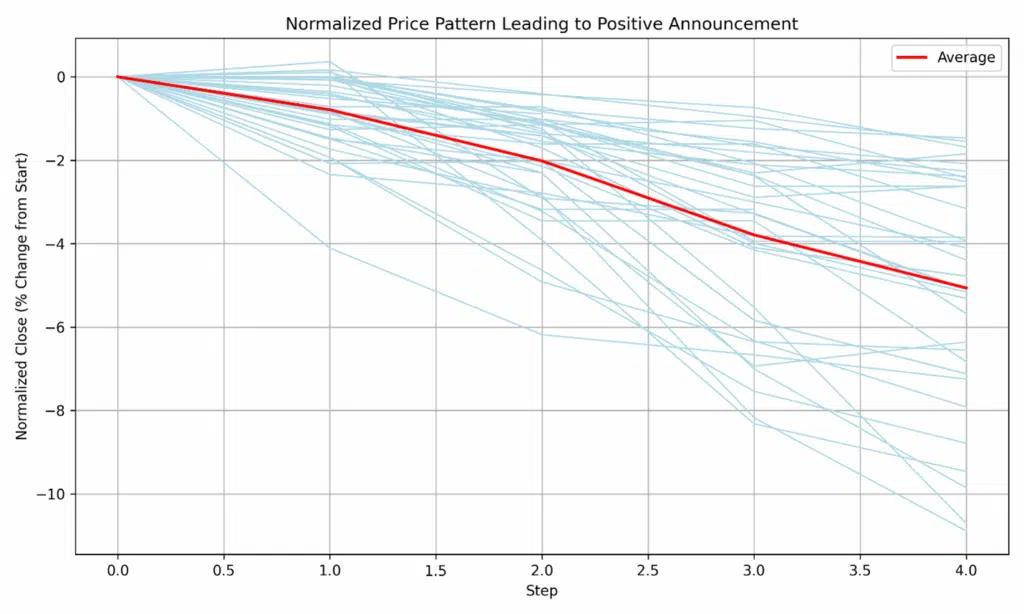
Finally, we combine both techniques to backtest a hypothesis: Does a positive earnings announcement reliably cause a stock to recover after a downturn?
We designed a combined query to find instances where:
- A stock’s price trended downwards for 5-10 days (via a TSS search).
- This was immediately followed by an announcement with text similar to “Headline earnings per share up” (via an HNSW vector search).
Using a powerful window join, we were able to find all occurrences of this combined event.
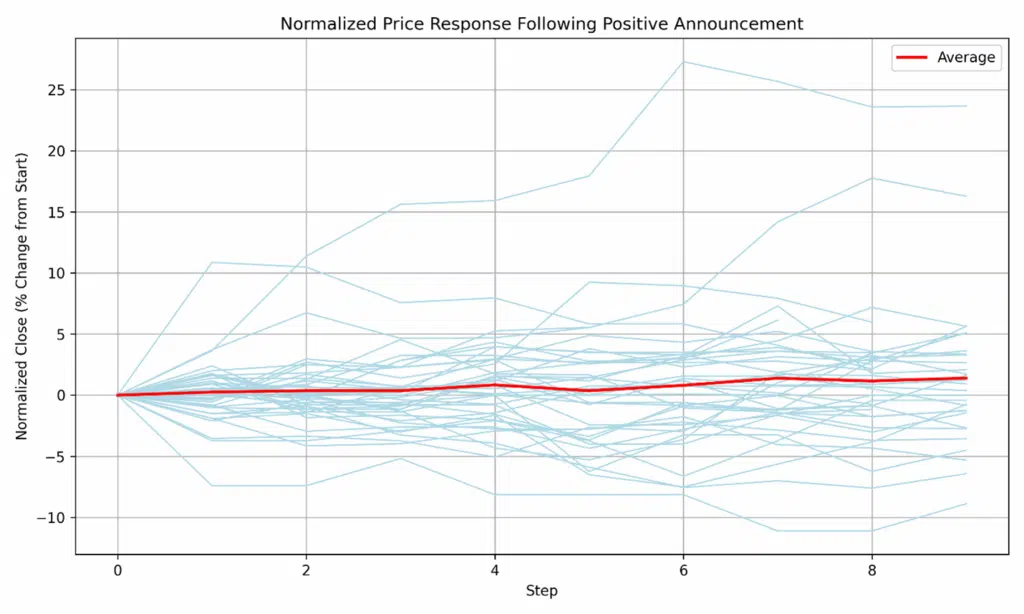
By analyzing the subsequent price action, we observed that while these positive announcements halted the bearish movement, the sharp “V-shaped” recovery identified from our previous example was less common, with stock prices increasing by a more modest 2%.
Combined market response following a positive announcement:
This tutorial demonstrates the analytical power that comes from breaking down the silos between structured and unstructured data. Using the integrated AI libraries within KDB-X, we were able to:
- Search by meaning: Starting with a simple text phrase (“interim results”), we found related announcements using vector search, and then analyzed the subsequent structured market data to measure the average stock price response
- Search by pattern: We inverted the process by first identifying a specific time series pattern (a V-shaped price dip and recovery) in market data, and then, by joining back to the unstructured text, found the news that likely caused the movement
- Backtest a hypothesis: By combining both techniques, we were able to test a specific theory, searching for a downward price trend (a structured pattern) followed by a positive earnings announcement (unstructured text) to see if a recovery occurred
This ability to seamlessly query, join, and analyze data based on both temporal patterns and semantic meaning in a single environment unlocks a far deeper and more nuanced understanding of market dynamics.
If you enjoyed this blog and would like to explore other examples, you can visit our GitHub repository. You can also begin your journey with KDB-X by signing up for the KDB-X Community Edition Public Preview, where you can test, experiment, and build high-performance data-intensive applications with exclusive access to continuous feature updates.