ポイント
- Backtesting requires a high-performance analytics stack that integrates historical and real-time market data to simulate trading strategies under real-world conditions.
- The accuracy of backtests depends on high-quality data, efficient processing, and the ability to scale across petabyte-level datasets with low latency.
- Fusing structured and unstructured data, such as market data with GenAI-driven insights from news or social media, provides deeper context for backtesting results.
- Time series databases enable tick-level "as-of" analysis, helping traders compare current market conditions to past scenarios for smarter intraday decisions.
- Platforms like KX kdb Insights Enterprise offer scalable, high-speed analytics solutions to accelerate backtesting and optimize trading strategies at scale.
Speed and accuracy are crucial when backtesting trading strategies.
To gain the edge over your competitors, your data analytics systems must ingest huge volumes of data, with minimal latency, and seamlessly integrate with alternative data sources.
This blog identifies the essential components you should consider to optimize your analytics tech stack and incorporate emerging technologies (like GenAI) to enhance backtesting at scale.
Key analytics considerations for effective backtesting at scale
When you backtest, you’re using your data analytics stack to create a digital twin of the markets within a ‘sandbox’.
By applying a set of rules to real-world, historical market data, you can evaluate how a trading strategy would have performed within a risk-free testing ground. The more performant this testing ground is, the less time it takes to develop new and improved trading strategies, allowing you to iterate and deploy your ideas faster than your competitors.
But how do you ensure your backtesting tech stack can operate at the speed and scale you need to be successful? Here, we’ll dig a little deeper into these essential components of effective backtesting.
The key considerations are:
- Data quality and management: Access to high quality historical data from a reputable source is essential for backtesting at scale. Focus on data aggregation, quality controls, and structured data to improve the speed and ease of retrieving data.
- Speed and efficiency: Speed and efficiency of your data analytics stack is crucial. Speed-to-insight is everything and any down time or latency can lead to missed opportunities and increased exposure to risk.
- User expertise:The effectiveness of your data analytics stack is also dependent on the expertise of the users and their understanding of the programming language on which your solution runs.
Most importantly…
- Scalability and flexibility: Determining the viability of a trading strategy requires the ability to process petabyte-scale volumes of high-frequency data – sometimes handling billions of events per day. You then need to be able to run concurrent queries to continually fine tune parameters and run quicker simulations. Your chosen database and analytics tools should be scalable to handle all of this without sacrificing performance.
By working with a platform that incorporates these essential features, you can run more informed simulations, more often. This shortens your time-to insight and enhances the level of confidence in your approach, obtaining accurate, empirical evidence that supports or opposes your strategies.
Having highly performant data analytics technology is crucial, but success doesn’t stop there. To gain the insights you need to optimize trade execution and generate Alpha, you need a granular view, informed by both historical and real-time data.
Fuse high-quality historical time series data with real-time data
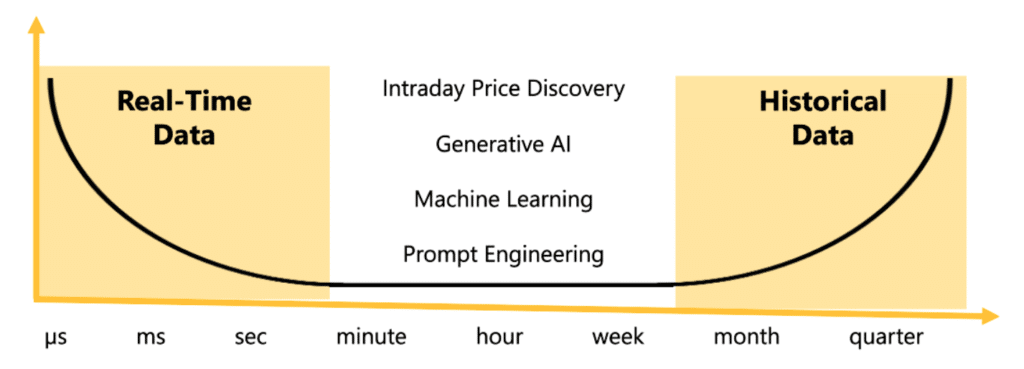
The biggest questions you face while backtesting require context, which is why high-quality historical data, from a reputable source, is vital. However, for a backtest to be valuable, it must also be timely and accurate. The accuracy is impacted by the realism of the backtest, which means the simulation must reflect real-world conditions.

You need massive amounts of historical data applied to real-time streaming data to accomplish this. Think of it like the human body’s nervous system. Real-time streaming data provides the sensory input. However, we require the accumulated history of whether that input means danger or opportunity to put the situation in perspective and make effective judgements.

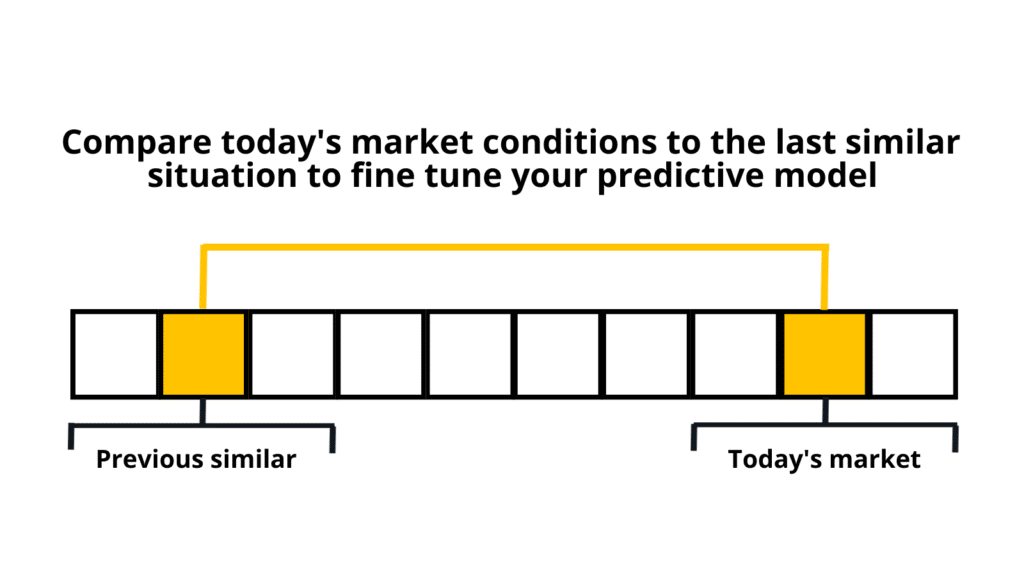
A time series database is like a video replay for market data that quants can use to analyze markets (e.g.,AS-IF)
The key is a high-performance system that allow you to test more quickly and accurately than your competition. By combining real-time streaming data with a time-series view of historical data, you can backtest your strategies against past market conditions, assessing their viability against previous trends and behaviours.
Find this balance when you backtest by leveraging a database that makes it easy to combine high-frequency, real-time data and temporal, historical data in one place. This allows applications to perform tick-level “as-if” analysis to compare current conditions to the past and make smarter intraday backtesting decisions.
Real-time and historical time series aren’t the only two data types you can fuse together to enhance your analytics…
Backtesting at scale with GenAI
Structured data has long been utilized in algorithmic trading to predict market movements. However, advancements in GenAI are making it easier and more cost effective to process unstructured data (PDF documents, web pages, image/video/audio files, etc.) for vector-based analysis.
Combining these types of data in the backtesting process is providing new opportunities to gain an analytics edge (Read “The new dynamic data duo” from Mark Palmer for a more detailed explanation).
These types of applications require data management systems to connect and combine unstructured with structured data via vector embeddings, synthetic data sources, and data warehouses to help prepare data for analysis. For example, new KX capabilities enable the generation of vector embeddings on unstructured documents, making them available for real-time queries.
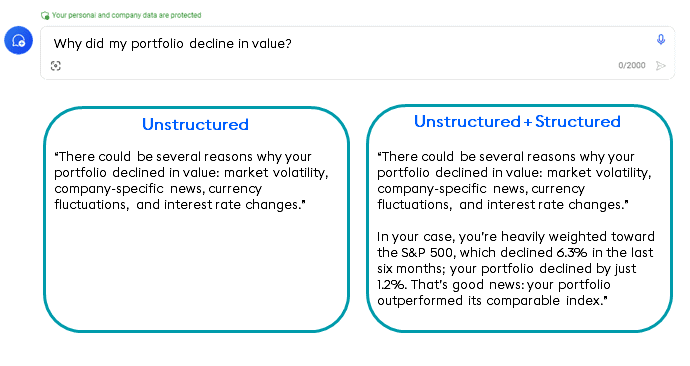
Using LLMs to merge structured market data with unstructured sources such as SEC filings and social media sentiment means you can generate queries that not only assess how your portfolio has performed, but why it performed that way.
For example, let’s assume a series of trades haven’t performed as well as expected. Your system can use its access to news outlets, social media sentiment, and other unstructured sources to attribute the downturn to broad factors such as market instability, specific corporate developments, and currency shifts, offering a more detailed perspective on potential causes for the underperformance.
The combination of structured and unstructured data represents a revolutionary step in data analytics, enhancing your ability to backtest with unique insights that were previously hidden.
Backtesting at scale: wrapped up
If you want to assess the viability and effectiveness of your trading hypotheses and get watertight strategies to market faster than competitors, then you need a highly performant analytics platform.
To backtest at scale, your analytics platform should offer speed, scalability, and efficient data management. It must also support multiple data sources and enable the comprehensive testing of complex trading strategies.
One such platform is kdb Insights Enterprise, a cloud-native, high-performance, and scalable analytics solution for real-time analysis of streaming and historical data. Ideal for quants and data scientists, Insights Enterprise delivers fast time-to-value, works straight out of the box, and will grow with your needs.
Discover how KX will help you accelerate backtesting so you can rapidly validate and optimize your trading strategies at scale here.


