By Ben Jeffery
Introduction
This article examines how the features of KX Analyst help developers and analysts write code in kdb+. In previous articles in this series, we have ingested taxi and weather data into kdb from multiple sources, and used visual techniques to gain some insight into the data. This article will outline the tools in KX Analyst for authoring custom analytics, including version control for managing code, tests, inspections, and data transformations.
In this article, we will write a query to identify return trips from a one-month sample of yellow cab taxi trips in New York City. This data includes the pick-up and drop-off co-ordinates, as well as the distance the taxi travelled. We can define a return trip as one where the pick-up and drop-off locations are very close, within 15 meters, but the distance travelled is much greater.
The haversine formula is used to find the distance between two latitude/longitude coordinates. We will write an implementation to find the distance between the pick-up and drop-off locations.
Code can be imported into Analyst from git repositories, or q files. Within these repositories, the code, files, visuals and other artifacts are organized into modules, which can optionally map to a q namespace. We can create a module “.taxi” to contain everything unique to our current analysis, and a module “.geo” for functions generically dealing with the geographic data that could be useful in other projects. We can load a repository of trigonometric functions to help us write the haversine function
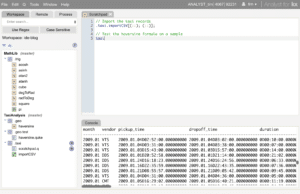
To write haversine, we need the 2-argument arctangent function. To check if this is function is in our math module and what its name is, we can type “.math.a” and press the autocomplete hotkey. We can then mouse over the name to get the function’s signature.

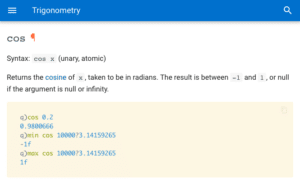
The haversine function uses the sin and cos functions. To check if these are expecting to be passed degrees or radians, we can select “cos” and press the Q Reference hotkey to open the documentation, and see that they expect radians.
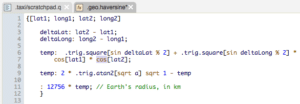
Having previously created the .taxi.importCSV transformation to load the taxi records, if we check the haversine function on a sample of the data, we find the average trip distance for our sample is only 29 metres, which does not seem correct .

Debugging
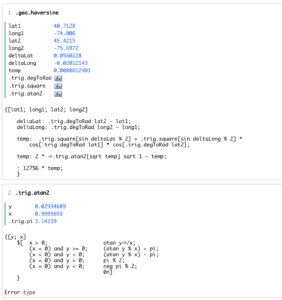
To investigate why the output is incorrect, we can debug a call to haversine, and step through until we find something unusual. We can see that because the second last line is missing a semicolon, it ran together with the line below it, which is why the last line appears to be executing before the second last line. If our code was throwing an error, the debugger can jump to the erroring operation, and give an interactive view of the call stack at that point.

The debugger can also integrate with the native q debugger to give a graphical view of the backtrace when an error occurs, in this case because the wrong operator was used for division.
Linting
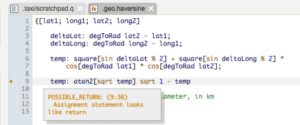
Opening the haversine function in an editor, we can see that there is a linter warning for the missing semi-colon, with a tooltip telling us the return statement is being treated as an assignment.
Searching
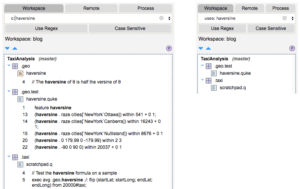
After fixing this error, if we want to see which files call .geo.haversine, and will be affected by our fix, we can search for any references to this function. A “uses” search will find all references to the function used in code, while a context search will do a full text search. Both searches can use regular expressions.
Version Control
Artifacts in Analyst are versioned using Git, allowing us to pull and push code, branch repositories, check out or cherry-pick from earlier versions, and resolve merge conflicts. This allows multiple people to collaborate on and share code, visualizations and transformations. Should we later need to see an earlier version of our code or revert to a previous state, we can view the repository’s history to find changes and compare versions.
Conclusion

We can now finish our analysis and use .geo.haversine to find the .4% of taxi trips that are return trips, where the pick-up and drop-off are close together, but the trip distance is much greater. IDE features like auto-complete, hover hint, and hot-key lookup of q keywords, operators and system commands make it easier to work with unfamiliar code. Git integration facilitates reviewing changes before pushing code without leaving Analyst, the debugger can help track down errors, and the linter warns about potential issues whenever we modify our code.
