


By Thomas Walsh
KX has a broad list of products and solutions built on the time-series database platform kdb+ that capitalize on its high-performance capabilities when analyzing very large datasets.
KX for Surveillance is a robust platform widely used by financial institutions for monitoring trades for regulatory compliance. The Surveillance platform instantly detects known trading violations like layering, spoofing or marking the close. Customers can calibrate their parameters in real time to improve their detection quality and accuracy. The flexibility of the historical database and replay engine eases retrospective investigation for new types of fraudulent behavior and suspicious activity.
In this series, we take a look at what makes KX for Surveillance such a powerful tool for detecting market manipulation. This second article in the series takes a close look at phishing.
Phishing is known as “executing orders to trade, or a series of orders to trade, in order to uncover orders of other participants, and then entering an order to trade to take advantage of the information obtained”.[1] In the context of market trading, this manipulation can take the form of an entity placing small orders on both sides of the market to test the liquidity of the market by analyzing on how quickly their orders are filled or remain in the market. The motivation is to uncover orders of other market participants and take advantage of them.
A consequence of this abuse is that it could temporarily alter the order book in the entity’s favor, allowing for a position at a price better than would have occurred in an orderly market, opposite to the ‘phishing’ order set if a latent interest is identified. The strategy is typically observed in securities with low liquidity (e.g. OTC) where price manipulation is easier to achieve as low volumes of trading means that it is easier to alter the price without needing to trade a large amount.
The manipulation occurs over a short period of time. This gives the market less time to revert to normal and reduces the probability that other entities may take similar advantage of the favorable market conditions (the exploitation of the timing of private and public data flows can be critical here).
The figure below demonstrates a potential instance of this type of market manipulation:
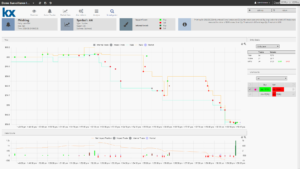
The top chart of the Investigation screen shows order execution alongside national market activity (including Best Bid and Offer); the lower chart tracks order volume alongside the net position for the trader-of-interest. The combination of these two charts allows an analyst to very easily see the landscape of the market and then decide whether the entities behavior was intentionally manipulative.
In the above scenario, the entity began the manipulation using a series of six small buy orders (all under 100 shares) to determine the market price (illustrated as green bubbles in the top graph).
Once established, the entity then proceeded to enter a series of small, aggressive sell orders to drive down this price. Typically, these orders are at or below the best bid (red bubble). The intention of this manipulation could be to create a large divergence between the National Bid and Offer. This series of trades can also reveal how liquid the market is by how quickly the orders were filled.
In the example above, the entity can then quickly take advantage by entering a set of (four) large buy orders within a short space of time; these orders execute at a significantly lower price than when first entered at their initial pinging order – a price advantage of about $1.40. The volume graph shows the entity’s net position hovered around zero for the majority of the investigation period; therefore the entity was not taking a meaningful position in the market up until the point the large orders were entered.
In the KX solution, the surveillance pattern works backwards by first identifying large orders or clusters of orders that when summed break set volume thresholds. Once identified, the pattern checks the entity’s orders prior to the breach.
The performance of the kdb+ database facilitates nanosecond (if available data allows it) analysis of every individual event, private and market. The amount of dislocation of the tape /quote is checked and a determination made whether the entity’s orders were active or reactive in relation to market movement; for example, by verifying their aggressiveness in respect to the best bid/offer. If their orders were aggressive and significant dislocation occurred, the activity will be flagged as suspicious.
The value of what a large/small order is can either be set to be a default or can be calculated via benchmarking on a per entity+sym basis. Benchmarking is the utilization of historical data in order to obtain a tailored threshold value for each entity value based on their normal trading characteristics.
Finally, the surveillance pattern also looks for multiple instances of this activity throughout the trading day in order to raise an alert. One reason for this is that the volumes traded during one instance can be quite low and therefore the potential profit is not significant. In contrast, multiple occurrences would result in higher potential profits, along with stronger evidence that the entity is deliberately attempting to manipulate the market utilizing the practice of phishing.
For more information on KX for Surveillance and its functionality please click on the links below.
[1] European Securities and Markets Authority – ESMA’s technical advice on possible delegated acts concerning the Market Abuse Regulation – 2015 – https://www.esma.europa.eu/sites/default/files/library/2015/11/2015-224.pdf


