

ポイント
- Start your own kdb+ real-time data capture architecture in 5 minutes, no prior experience needed!
- Get a clear overview of each core process, what it does, how it works, and how they all connect.
- Build a fast, scalable, and resilient tick system for real-time and historical analytics using a single stack.
If you’ve ever worked on a production data platform, you know the drill. To accomplish anything meaningful, you could be expected to know half a dozen systems, one for ingestion, another for streaming, and sometimes several for storage, and that’s just the basic stack. At times, it can feel more like navigating an obstacle course than handling data.
But what if you could do more by doing less? What if you could learn how to set up a full tick architecture that handles data front to back, without stitching together multiple components or context-switching between tools?
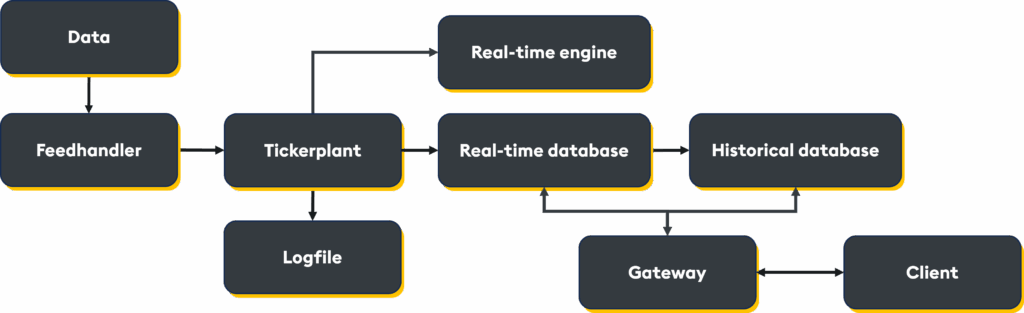
In this blog, I’m going to show you how quickly you can set up a simple but powerful tick architecture using q, kdb’s vector functional language. I will demonstrate how each q process in the kdb+ tick architecture has a distinct role, and how they are designed to work together. Don’t worry if you’re new to kdb+/q; we’ll be following the kdb+ architecture course outline, which has been created for complete beginners.
If you would like to follow along, you can either launch a Sandbox from the kdb+ architecture course or on your own environment via git clone https://github.com/KxSystems/kdb-architecture-course/tree/master. This, however, will require kdb+ to be installed with a valid license and the q alias set to invoke kdb+.
Within the repository, you will see a list of scripts, each designed to set up a specific process. You will also need to open a new terminal window per process you wish to start.
Tickerplant
The tickerplant has three integral roles in a kdb+ system:
- Publish the data it receives to all subscribers.
- Log every tick of data into a TP log in case of outage or system failure to ensure no data loss.
- Kick off the end-of-day procedure for the whole system.
The tickerplant is the time-keeper of the roll over (end of day process) of the system, and the guarantor of data integrity and resilience. To create a tickerplant, launch a q process, loading in the tick.q script:
q tick.q sym . -p 5010The tickerplant process loads the sym.q file, which contains the schema definitions for the entire system. This way, you define the schemas you need once and use them across the architecture, leaving no room for mismatch errors during data ingestion.
The sym.q file looks like this:
trade:([]time:`timespan$();sym:`g#`symbol$();price:`float$();side:`symbol$());Setting the port number (using -p 5010 in this example) when starting each process allows the components within the system to communicate via Interprocess communication (IPC). The tickerplant has an inbuilt function .u.w, which will show how many processes have subscribed to it, so at any given time you can check your system is still connected and running as it should.
Real-time database (RDB)
The RDB exists entirely in memory; and serves a transitional role in the pipeline:
- It receives and stores the intra-day data in memory until the end-of-day procedure has run.
- It supports fast ad-hoc queries on in-memory data.
- At end-of-day, it writes intra-day data to disk and signals the HDB to reload once complete.
The RDB also allows graceful recovery using the TP logs after failure, avoiding data loss.
To create a real-time database, open a new terminal window and launch a q process reading in the rdb.q script:
q tick/rdb.q -p 5011When the RDB starts up (using -p 5011 to set the port), it connects to the tickerplant to retrieve the schema of the tables it will receive and the location of the TP log file. Running tables[] on the RDB will show what tables the RDB has subscribed to:
tables[]
,'trade
The tables remain empty until the tickerplant starts to publish, which can be seen by querying the table:
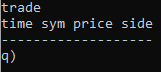
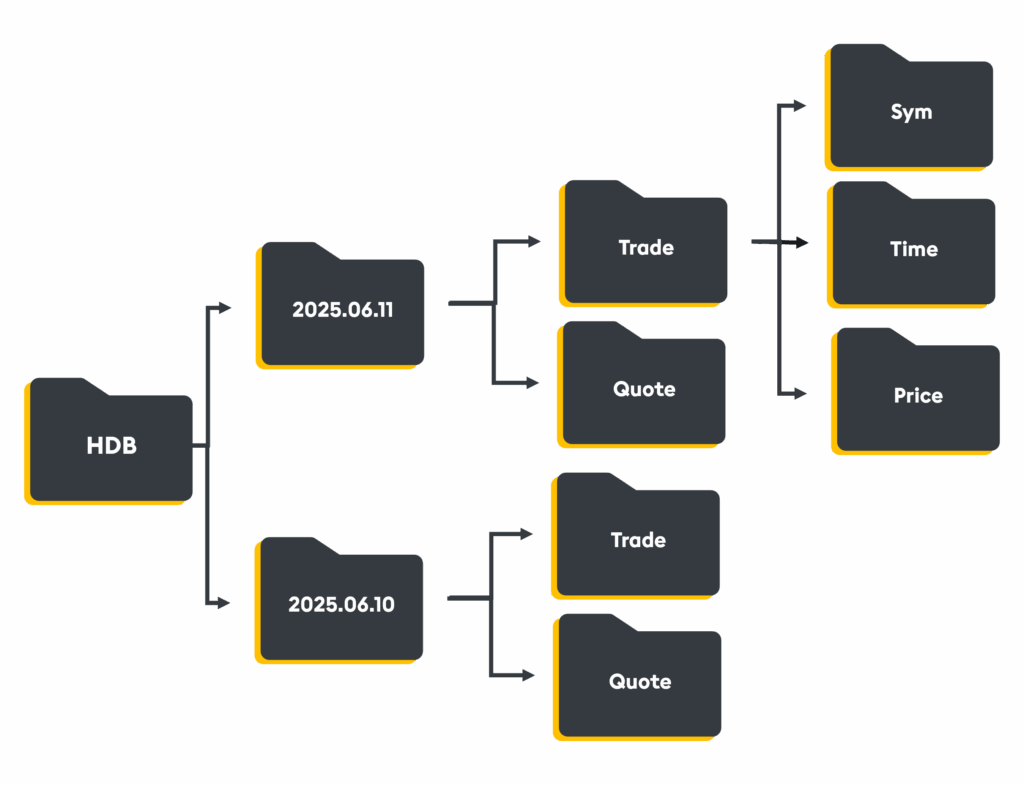
Historical database (HDB)
The Historical Database is where all historical data, spanning days, weeks, or even years, is saved. It is designed to serve large-scale queries at speed, without requiring the entire dataset to be pulled into memory. Its columnar format and memory mapping allow it to scan disk-based data with astonishing efficiency. Attributes and enumerations (e.g. partitioned by data, sorted by time, grouped by symbol) optimize both storage and retrieval, returning queries in milliseconds, not minutes, even over years of data.
With thoughtful design, the HDB ensures performance doesn’t degrade as data accumulates.
To create a Historical Database, open a new terminal window and launch a q process on a new port (5012) reading in the hdb.q script:
q tick/hdb.q sym -p 5012Feedhandler
In a production system, a feedhandler serves as the point of entry for upstream data sources, including market data vendors or internal systems. It converts raw data into a format suitable for downstream storage and processing.
By converting high-throughput external feeds into structured internal formats and publishing them asynchronously, the system can ingest data at scale without blocking or bottlenecking.
To simulate data flowing through our system, we can create a feedhandler by launching a q process:
q tick/feed.qTo manually create dummy data on this process and publish it to the tickerplant, we will run:
h_tp:hopen 5010;
h_tp"(.u.upd[`trade;(2#.z.n;2?`APPL`MSFT`AMZN`GOOGL`TSLA`META;2?10000f;2?`B`S)])"
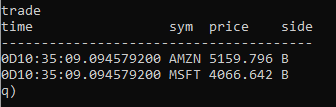
At this stage, we can go back to the RDB to show the system has been set up correctly, by checking that the trade table has been populated:
To check the HDB process, we trigger the end-of-day process by running the following code on the tickerplant:
.u.endofday[]Checking the RDB again will show an empty trade table as the data has been written down to disk. This can be verified via the HDB:
select from tradeReal-time engine (RTE)
By subscribing directly to the TP, the RTE performs calculations and transformations on live data as it flows through the system, without waiting for it to be stored or queried later, thereby enabling streaming analytics and providing immediate insight.
To create a real-time engine, or real-time subscriber, open a new terminal window and launch a q process reading in the rts.q script:
q tick/rts.q -p 5013Once you have the RTE process running, you can recreate some data on the feedhandler using the same code as before. The data will flow through the tickerplant and be published to both the RDB and the RTE.
The RTE will hold the aggregated data in memory in a keyed table called latestSymPrice:
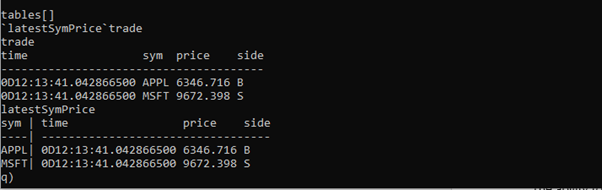
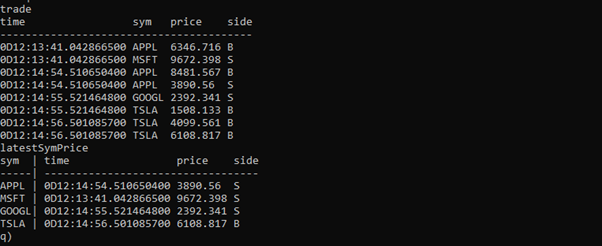
If you publish more data from the feedhandler, rows will be added to the trade table on the RTE, but the latestSymPrice table will update as the data is received:
By performing real-time enrichment or summarization upstream, RTEs reduce downstream load, prevent redundant computation, and empower smarter decisions sooner. Abstracting these calculations from the data ingestion processes, protecting the system, and reacting to high-frequency data in real-time.
Gateway
The gateway is the client entry point into the kdb+ system. It is responsible for routing incoming queries to the appropriate processes and returning the results. In this example, a function is defined on the gateway process to return the requested data from the RDB and/or the HDB.
To create a Gateway, launch a q process in a new terminal window reading in the gw.q script:
q tick/gw.q -p 5014You can call the function with three parameters: start date, end date, and symbol:
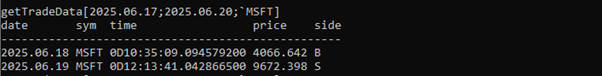
The abstraction that a gateway offers reduces query latency, enforces entitlements, and routes requests efficiently across the architecture. For queries that span timeframes (e.g., today and last month), the gateway splits and optimizes the request per target, ensuring each process gets the appropriate query and nothing more.
With asynchronous messaging and load balancing, gateways scale user access without creating contention, enabling many concurrent users without slowing down the system.
And that’s it, you are now equipped with everything you need to set up a real-time kdb+ architecture. Why not try:
- Adding your own data feed.
- Creating custom streaming analytics.
- Setting up logging to prevent data loss.
There is power in the simplicity of a kdb+ system. Each process is engineered to serve a specific function and, when set up correctly, removes latency, complexity, and bottlenecks from the data workflow. Using a single system, tool, and stack that is optimized to perform at every level, with components designed to work seamlessly together, empowers architects to build high-performance systems that scale with data growth, remain resilient under load, and deliver low-latency access to both live and historical datasets.
To learn more, check out the kdb+ architecture course on the KX academy, or watch this panel discussion for best practices in designing, managing, and optimizing your kdb+ stack.