

By Steve Wilcockson
Most people get a surprise when they click on their Google timeline notifications, suddenly remembering journeys they had forgotten or sequences of events that, in retrospect, explain how later outcomes unfolded. For individuals it may be a passing curiosity to review such histories, but for organisations, particularly if those past events can be combined with current observations to spark actions and predictions rather than simply reflection, it can be transformative in informing their decision-making. Suitably implemented, it can ensure better outcomes in areas ranging from improved performance and quicker response times to sustained quality of service and uptime.
The discipline is called “Applied Observability”, and it is cited by Gartner as a top trend for 2023. It operates by taking digital footprints from sources like logs, traces, API calls, dwell time, downloads and file transfers and combining them in a “highly orchestrated and integrated approach to enable decision making in a new way across many levels of the organization”.
Like the concepts of “big data” in the past and “data analytics” today, it is a discipline whose mainstream adoption belies that fact that it has been practiced for years, but technology is now making it easier. Kdb insights is an example of such a technology in applied observability – in all three in fact. It has long been processing large data volumes on Wall Street and more recently across industry where its algorithms are streamlining operations across production lines and boosting performance on F1 racetracks. In the process, it has solved the technical problems of capturing multiple data sets, of different formats and frequencies, and correlating them in real-time with historical data in a resilient, scalable manner.
What remains makes it easy for data application developers and scientists, using their familiar tools like Python, R and SQL, to extract the business insights and inform split-second decisions that can make or save millions of dollars. In effect, kdb+ Insights makes applied observability easy. It takes what is happening right now and infuses it with historical context to deliver instant actionable intelligence.
The applications are widespread. In a trading environment, it may be used to monitoring quote acceptance and rejection levels across dates, maturities, or counterparties to detect trends or initiate revised spread levels. At a market surveillance level, it may be used to track trade/order ratios or monitor cancellation rates for indicators of manipulative trading activities that warrant investigation or immediate intervention. On the factory floor, it may identify anomalies and remediation that would otherwise have resulted in batch loss or machine downtime. On the racetrack, the overlaying of lap, tyre, brake, and acceleration measures may inform race strategy.
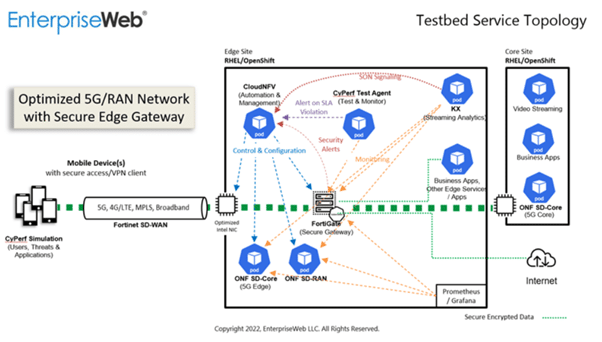
A recent project illustrated it particularly well in the world of telecommunications where applied observability was used to recalibrate a carrier network in two contrasting scenarios: the first to maintain quality of service in response to a normal increase in traffic and the second to protect to overall network in response to a Distributed Denial of Service attack. In both cases, it monitored the flow and profile of the streaming data sources to issue alerts where threshold levels were breached and sent signals back to a central orchestrator directing the appropriate adjustments to make. It is the latter capability, the ability to analyse and recommend in real time, that distinguishes the action-driven nature of applied observability from the relatively passive reporting function of traditional monitoring solutions.
The solution topology is illustrated below and highlights the importance of integration and open standards in achieving applied observability across an ecosystem: high levels of connectivity to capture data sources across different protocols and formats and integration with application stacks to automate the appropriate changes, all underpinned by the performance and scalability of kdb+ to perform the requisite real time analytics.
Kdb Insights is agnostic about the systems, format and volume of information it can capture and processes. It is built upon open cloud-based technologies that enable interfacing to virtually any system, an analytics capability for complex querying and machine learning and a visualization capability that makes applied observability intuitive, comprehensive and effective. The overarching components of kdb insights that enable it include:
Optimized for time series data
Most data today is time series based, generated by processes and machines rather than humans. Any analytics database should be optimized for its specific characteristics like append-only, fast, and time-stamped. It should be able to quickly correlate diverse data sets (asof joins) and perform in-line calculations (vwaps, twaps), as well as execute fast reads and provide efficient storage.
Openness and Connectivity
The data landscape of most large, modern enterprises is broad. This means that any analytics engine has to interface with a wide variety of messaging protocols (eg: Kafka, MQ, Solace) and support a range of data formats (eg: CSV, JSON, FIX) along with IPC (Interprocess communication), REST and OPENAPIs for quick, easy connectivity to multiple sources. It should also cater for reference data, like sensor or bond IDs, that enable it to add context and meaning to streaming data sets, giving the ability to combine them in advanced analytics and share as actionable insights across the enterprise.
Real-time and Historical Data
By combining real-time data for immediacy with historical data for context, companies can make faster and better in-the-moment responses to events as they happen and eliminate the development and maintenance overhead of replicated queries and analytics on separate systems. This ability to rapidly process vast quantities of data using fewer computing resources is also well suited for machine learning initiatives, not to mention reducing TCO and helping businesses to hit sustainability targets.
Easy Adoption
Look for analytics software built with microservices that enable developers and data scientists to quickly ingest, transform and publish valuable insights on datasets without the need to develop complex access, tracking, and location mechanisms. Complications like data tiering, aging, archiving, and migration can take up valuable time and resources which could be better used to concentrate on extracting actionable insights. Natively integrated with major cloud vendors and available as a fully managed service should also be an important consideration for easy adoption.
Proven in production
While time series databases have been around for a long time, the ever-growing volume, velocity, and variety of data, and the need to generate rapid insights and actions from it, means that many technologies are not proven in the field. Look for software with robust use cases and clear examples of ROI.
Prevention is better than cure, almost everyone would agree. In its absence, early detection should be the goal, determining from past experience that a particular set of events or indicators suggests a failure is imminent and that taking action now can forestall its negative impact. Both are the focus of applied observability which Gartner has identified as a top strategic technology trend for 2023. For more information on this and other trends, click here to read the report in full or contract KX for a demo.


