Structured market data is Wall Street’s heartbeat. Most banks have exceptional tick stores capturing micro-movements in prices, trade executions, and related fundamentals and sentiment.
In recent years, unstructured data has been invited to the party. Firms have started using advanced analytics and AI techniques to identify patterns and trends in news articles, social media, earnings calls, etc., to help enhance their decision-making capabilities.
These techniques assess similarity (e.g., approximate nearest neighbor algorithms, vector databases, data encoding) to power applications that process primarily unstructured data: natural language processing, image, audio, and video processing.
But why stop there? Why not apply the same techniques to our old friend, structured data?
Such an innovation could bring the magic of similarity search to time-series data to help quantitative analysts assess market micro-movements and predict what might happen next.
It’s called temporal similarity search, bringing AI’s secret sauce to quantitative trading.
Here’s an overview of temporal similarity search and why it’s the newest powerful trading tool Wall Street analysts use today.
The challenge: Quant trading and volatile moments in time
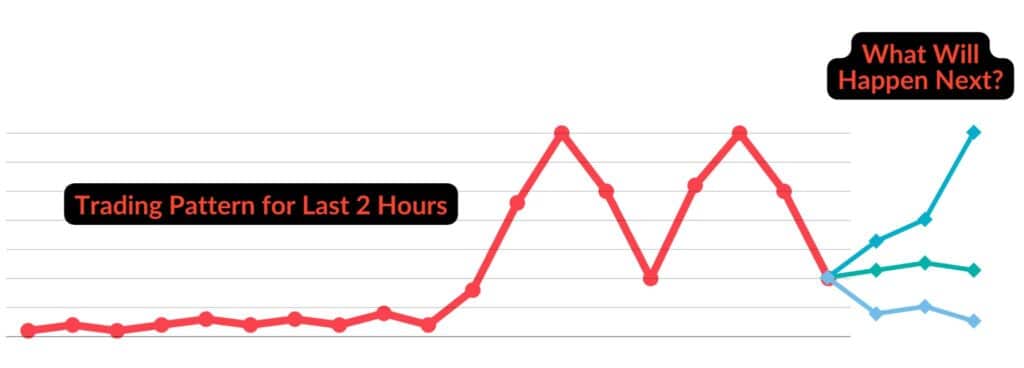
Imagine you’re a trader in the capital markets. You hold a significant position in IBM, and it generally fluctuates within its ‘typical’ range according to historical norms. Suddenly, IBM’s price surges outside its normal range, and you get an alert. You watch with great interest as the price drops, but not back to its ‘expected’ price. Then it spikes again, then down, forming the ‘shape’ of an M (see below).

Your portfolio manager calls. “What’s going on?”
”What will happen next?”
Sometimes, volatility is easily explained. Earnings releases, news, or poor performance by a related company are often the underlying cause of market moves.
But usually, there’s more to be understood.
Understanding the heartbeat of Wall Street
Capital markets data skip, swing, and spike like our human heartbeats. Most banks have exceptional tick stores of micro-movements of prices, trade executions, and related fundamentals and sentiment. The trick is finding similarities and dissimilarities among these patterns. Temporal similarity search helps quantitative traders assess the time window patterns like needles in a haystack based on a clever application of the ‘Approximate Nearest Neighbor’ algorithm to temporal data.
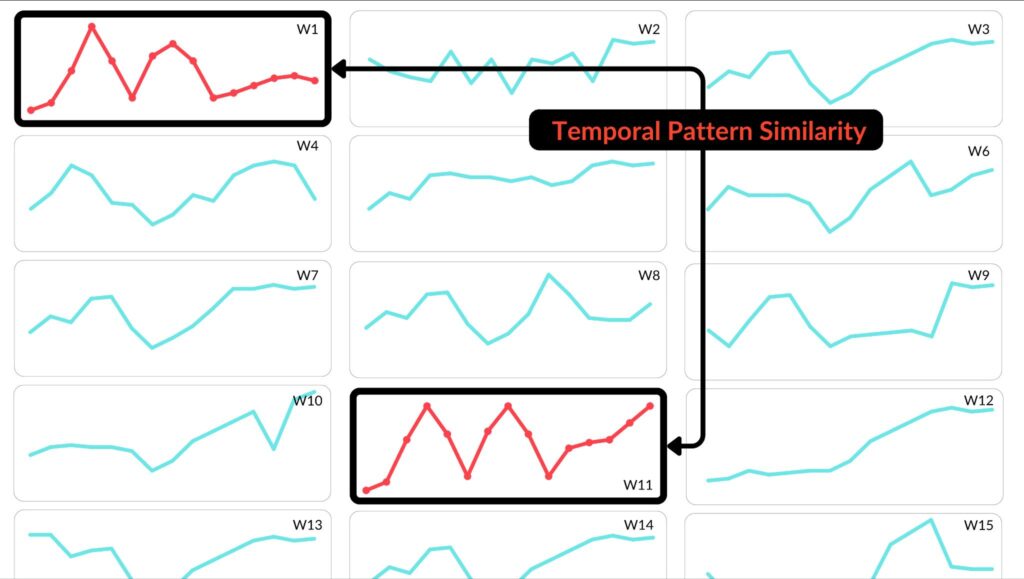
For example, analysts can query a historical ticker plant for time windows in the past year that match the ‘M’ pattern in the example above. It returns a set of time windows that match the pattern, ranked by similarity.
By instantly finding similar patterns within millions, billions, or trillions of time-series data patterns, analysts can quickly compare the underlying factors that might have caused this pattern of activity. Perhaps more importantly, they can use this information to compare current conditions to those in the past and predict what might happen next.
Temporal similarity search in action
Temporal similarity search starts with a query: analysts provide a signature of data movement and a range of search times. For example, “Find me the most similar M shapes in the last month.” The system then searches for similar patterns in its historical ticker plant, ranks, and returns the results.
Below are fifteen time-windows showing a similar pattern:

Finding these heartbeat patterns is just the first step.
Now, we must ask the critical question: what happens next?
To answer, we compare two (or more) time slices. For example, in week one, after an M-shaped flutter, the price flattened but stayed above its historical norm, but in week 11, it adjusted to the new high-water mark. Analysts compare, filter, and explore these patterns as they gain insight.

This three-step process of searching, comparing, and exploring these temporal heartbeats and data continues as analysts uncover new questions to ask and conditions to find similarities within.
But that’s not all. Not only can temporal similarity search be used for exploratory analytics, but the technology also has a continuous mode of execution that allows in-stream analysis of data for patterns as they happen. This style of deploying continuous similarity search helps power real-time applications like surveillance, execution analytics, and many alerting systems.
The resulting system of comparative analytics, accelerated by the similarity search deployed on either historical or streaming data, significantly enhances the speed and efficiency of analysts’ work. By using temporal patterns as a baseline for exploration, analysts can perform their tasks faster and more effectively.
- Analysts provide a ‘signature’ or pattern of data movement to the similarity search engine.
- Similarity search finds and ranks similar time-series ‘windows’ and returns the closest fits to this shape.
- Analysts use these time windows to analyze, compare and contrast subsequent market movements, predict what might happen next, and act.
Use cases of temporal similarity search
Temporal similarity search is a versatile technique that can power any application that processes time series data. Its two execution modes — continuous and historical — make it adaptable to a variety of market conditions, powering a range of applications on Wall Street.
- Quant research. Historical temporal similarity search helps quantitative trading experts compare a given time-series pattern to historical time windows to analyze trading strategies with “as if” conditions to simulate and compare behavior in similar markets
- Execution analytics. Execution analytics depends on finding the right time to execute a trade based on price, commissions, fees, volumes, and market impact. These factors dynamically fluctuate during the day, so continuously assessing them in the context of similar favorable and unfavorable patterns helps traders quickly spot the best time to act
- Algorithmic trading. Algorithmic trading strategy is sensitive to market prices, trading position size, execution strategy, portfolio requirements, order flow, risk, and exposure. Continuous temporal similarity search helps assess these parameters for optimal algorithmic trading
- Trade surveillance. Understanding deceptive, disallowed, or manipulative trading patterns depends on detecting similarity in trading motion. Trade surveillance applications can more easily spot patterns indicating trade layering, spoofing, front-running, or 123-go for compliance, risk, or regulatory surveillance applications
These applications all benefit from understanding the similarity and dissimilarity among moments in the market — and their underlying causes.
Temporal similarity search: A new way to assess the heartbeat of the capital markets
Thanks to the innovative application of AI technologies to structured, streaming, and historical time-series data, quant traders now have a new tool in their analytics toolbox. Temporal similarity search helps quantitative analysts understand the heartbeat of any market data and more confidently predict what might happen next (or, at least, should have happened).
For a deeper dive into the technology behind temporal similarity search, read: Turbocharge kdb+ databases with temporal similarity search. Learn how KX can help your firm seamlessly analyze data patterns, compare market activity, and detect anomalies as they occur with pattern and trend analytics.


