By Ferenc Bodon PhD.
Ferenc Bodon is an expert kdb+ programmer, as well as an experienced software developer in several other programming languages, and a software architect with an academic background in data mining and statistics who has published a number of technical articles over the years. Follow Ferenc on LinkedIn to see his continuing series on programming language comparisons. Ferenc originally published this article with the title: Python for data analysis… is it really simple?!?
Python is a popular programming language that is easy to learn, efficient and enjoys the support of a large community. Its primary data analysis library, Pandas, is gaining popularity among data scientists and data engineers. It follows Python’s principles, so it seems to be easy to learn, read and allows rapid development… at least based on the textbook examples.
But, what happens if we leave the safe and convenient world of the textbook examples? Is Pandas still an easy-to-use data analysis tool to query tabular data? In this article I will take an example that goes just one step beyond the simplest use cases by performing some aggregation based on multiple columns. My use case is not artificially made up to cover an unrealistic corner case. Anybody who analyzes data tables will bump into the problem, probably on the third day. For comparison, I will provide the SQL and q/kdb+ equivalent of some Python expressions. You can find the source code on GitHub.
The table-based data analysis includes:
- applying a grouping
- calculating sum of multiple columns
- calculating multiple aggregations (sum and average) of a single column
- calculating weighted average where weights and the values are given by two columns
The Problem
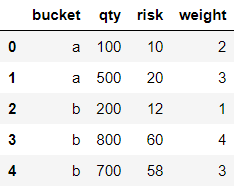
Let us see the exercise formally. We are given a table with four columns
t = pd.DataFrame({'bucket':['a', 'a', 'b', 'b', 'b'], 'weight': [2, 3, 1, 4, 3],
                  'qty': [100, 500, 200, 800, 700], 'risk': [10, 20, 12, 60, 58]})
t
We would like to see for each bucket:
- the number of elements, as column NR
- sum and average of qty and risk, as columns TOTAL_QTY/TOTAL_RISK and AVG_QTY/AVG_RISK
- weighted average of qty and risk, as columns W_AVG_QTY and W_AVG_RISK. Weights are provided in column weight.
Each aggregation is relatively elementary and Pandas documentation shows how to get the result. We will not use any deprecated approach e.g renaming aggregation by a nested dictionary. Let us solve each task separately.
Number of elements in each bucket
Getting the number of elements in each bucket is a bit awkward and requires intense typing.
t.groupby('bucket').agg({'bucket': len}).rename(columns= {'bucket':'NR'})The literal bucket is required three times and you need to use five brackets .
In contrast, the underlying SQL expression is:
SELECT COUNT(*) AS NR, bucket FROM t GROUP BY bucketThe q/kdb+ expression is even more elegant. It requires no brackets or any word repetition:
select NR: count i by bucket from tAggregation of multiple columns
Getting the sum and average of a single column and getting the sums of multiple columns are quite simple with Pandas:
t.groupby('bucket')['qty'].agg([sum, np.mean]).rename(columns={'sum': 'TOTAL_QTY', 'mean': 'AVG_QTY'})t.groupby('bucket')['qty', 'risk'].agg(sum).rename(columns={'qty': 'TOTAL_QTY', 'risk': 'TOTAL_RISK'})
The code gets nasty if you try to combine the two approaches as it results in column name conflict. Multi-level columns and a function map need to be introduced
res = t.groupby('bucket').agg({'qty': [sum, np.mean], 'risk': [sum, np.mean]})
res.columns = res.columns.map('_'.join)
res.rename(columns={'qty_sum':'TOTAL_QTY','qty_mean':'AVG_QTY',
                    'risk_sum':'TOTAL_RISK','risk_mean':'AVG_RISK'})
The q/kdb+ equivalent does not require introducing any new concept. The new aggregations are simply separated by commas. You can use keyword sum and avg to get sum and average respectively, for example:
select
   TOTAL_QTY:  sum qty,
   AVG_QTY:   avg qty,
   ...
 by bucket from t
Weighted average
Weighted average is supported by Numpy library that Pandas relies on. Unfortunately, it cannot be used in the same way as e.g. np.sum. You need to wrap it in a lambda expression, use apply instead of agg and create a data frame from a series.
t.groupby('bucket').apply(lambda g: np.average(g.qty, weights=g.weight)).to_frame('W_AVG_QTY')Again the q/kdb+ solution does not require introducing any new concept.
Function wavg accepts two columns as a parameter:
W_AVG_QTY: weight wavg qtyAll in one statement
Let us put all parts together. We created multiple data frames, so we need to join them:
res = t.groupby('bucket').agg({'bucket': len, 'qty': [sum, np.mean], 'risk': [sum, np.mean]})
res.columns = res.columns.map('_'.join)
res.rename(columns={'bucket_len':'NR', 'qty_sum':'TOTAL_QTY','qty_mean':'AVG_QTY',
                    'risk_sum':'TOTAL_RISK','risk_mean':'AVG_RISK'}).join(
    t.groupby('bucket').apply(lambda g: np.average(g.qty, weights=g.weight)).to_frame('W_AVG_QTY')).join(
    t.groupby('bucket').apply(lambda g: np.average(g.risk, weights=g.weight)).to_frame('W_AVG_RISK')
)
To get the final result, you need three expressions and a temporary variable. If you spend more time searching forums then you can find that this complexity is partially attributed to deprecating nested dictionaries in function agg. Also, you might discover an alternative, less documented approach using solely function apply and requires no join.
def my_agg(x):
    data = {'NR': x.bucket.count(),
            'TOTAL_QTY': x.qty.sum(),
            'AVG_QTY': x.qty.mean(),
            'TOTAL_RISK': x.risk.sum(),
            'AVG_RISK': x.risk.mean(),
            'W_AVG_QTY':  np.average(x.qty, weights=x.weight),
            'W_AVG_RISK':  np.average(x.risk, weights=x.weight)
           }
    return pd.Series(data, index=['NR', 'TOTAL_QTY', 'AVG_QTY', 'TOTAL_RISK',
                                  'AVG_RISK', 'W_AVG_QTY', 'W_AVG_RISK'])

t.groupby('bucket').apply(my_agg)
This solution requires creating a temporary function that will probably never be used again in your source code. Besides, this second approach is slower on mid-size tables.
It seems coming up with a stateless solution for a stateless query is not possible in Pandas. In contrast, SQL could already solve this 30 years ago. Let us see how q/kdb+ solves the task:
select NR: count i,
   TOTAL_QTY:  sum qty, AVG_QTY:   avg qty,
   TOTAL_RISK: sum risk, AVG_RISK: avg risk,
   W_AVG_QTY: weight wavg qty,
   W_AVG_RISK: weight wavg risk
by bucket from t
I assume we all agree that this is a more intuitive, simpler and more readable solution. It is stateless and requires no creation of temporary variables (or functions).
What about the performance?
Based on my experiment the q solution is not only more elegant but it is also faster by an order of magnitude. The experiments were conducted on both Windows and Linux using the stable latest binaries and libraries. Queries were executed hundred times, test scripts are available on Github. The table below summarizes execution times in milliseconds. The two Python solutions are compared to the single q query. In q the input table can contain a bucket column of type either string or symbol (preferred).
I would like to thank Péter Györök and Péter Simon Vargha for their insightful bits of advice.


