From obligation to opportunity: Redefining best execution 

“…ascertain the best market for the subject security, and buy or sell in such a market so that the resultant price to the customer is as favorable as possible…” – FINRA Rule 5310  

The days of shouting across a packed trading floor are long gone, but while modern financial dealing may be quieter, executing effectively is now vastly more complex and challenging. Amid the gentle hum of servers, your traders face a high-pressure environment where milliseconds can mean millions of dollars.  

In today’s fragmented and highly competitive markets, achieving best execution demands more than a laser focus on price; you must weigh varied factors from order size to venue selection.  

Capital market firms are stepping up to this challenge—not just because best execution is vital to proprietary alpha generation but also because it’s critical to delivering good customer outcomes. Yet, while gaining a competitive advantage and attracting more loyal clients are strong calls to action, you must also beware of tightening regulations that make best execution essential, not optional.  

Like Odysseus sailing between the monster Scylla and the whirlpool Charybdis, your firm needs to chart the right course for profitability and customer value while avoiding regulatory wrath or the danger of being sucked down by the complexity and costs of compliance.  

Whether your focus is equities, derivatives, bonds, forex, or any other type of instrument, read on as we explore what it takes to successfully navigate the challenges of best execution amidst the complexities and pace of today’s capital markets.   

Best execution goes beyond price  

Markets and trading strategies continuously evolve, as do the standards for best execution. As manual trading gave way to electronic systems in the 1980s, real-time algorithmic approaches in the 2000s, and the modern era of AI and machine learning, any tolerance for errors or delays vanished.  

Today’s constant connectivity, combined with automated execution at the speed of thought, means that precision and efficiency are now not exceptional, but expected.   

Firms have a vast range of trading venues at their fingertips and a torrent of streaming information, commonly 100,000 ticks per second or more, to leverage for optimal outcomes. Harnessing this data has enabled firms to broaden their view of best execution far beyond price—assessing complex factors like transaction costs and market liquidity in real-time to achieve the best possible results.  

Meanwhile, tightening regulatory scrutiny is also raising the bar for execution. Whether it’s MiFID II in the EU or the Dodd-Frank Act and Regulation NMS in the US, financial firms are obliged to act in customers’ best interest when executing orders. Updated rules again define best execution as more than just securing an optimal price—demanding that firms consider a range of factors like transaction cost, speed, and the likelihood of settlement. To demonstrate compliance, firms are also expected to monitor and analyze trading outcomes compared to the market and report on the results.  

Best execution: A high-stakes pursuit  

For capital market firms engaged in proprietary high-frequency trading, best execution is primarily about accelerating alpha generation, minimizing costs and mitigating risk.  

For example, let’s say you’re executing a pairs trading strategy for gold and silver. Suddenly, an exploitable price gap emerges, but you execute at a sub-optimal venue or 100 milliseconds too late—leading to increased slippage, higher fees, and reduced or negated profits.   

High-quality execution is similarly important on the risk management side of the equation to minimize losses from sudden and unexpected market movements, like the infamous GameStop short squeeze.  

For financial firms that deal with client orders, demonstrating best execution is also vital to attracting and retaining customers. Failure means losing trust, a damaged reputation, and the potential for significant regulatory penalties.   

We’ve seen high-profile examples over the past few years, including the SEC fining online brokerage Robinhood $65 million in 2020 for offering customers inferior execution prices. Even more recently, in 2022, FINRA fined Deutsche Bank Securities $2 million for failing to meet best execution obligations after routing orders in a way that created inherent delays and potentially lower fill rates.  

Powering best execution  

With milliseconds now making the difference between success and failure in the markets, firms need to leverage a wide range of data, technology, and processes to act quickly and confidently, drive better customer outcomes, and ensure regulatory compliance.  

Optimizing execution is a multifaceted challenge that must balance trade characteristics, like order size and asset type, with wider market conditions. For instance, firms need to consider factors like:  

  • Volatility: In turbulent markets with rapid price movements, like cryptocurrencies, firms must be able to monitor and react to changes in real time to achieve best execution  
  • Liquidity: In more illiquid markets, like fixed-income investments, or when executing large orders, firms must minimize price slippage  
  • Venue selection: In today’s fragmented markets, the choice of where to execute a trade is crucial, as each venue involves different fees, execution speeds, and liquidity levels  

Best execution has evolved from a regulatory obligation to a competitive opportunity. Firms are increasingly leveraging the power of data to deliver and demonstrate optimal outcomes while improving operational efficiency. Key solutions include:  

  • Real-time data analytics: The ability to ingest, process, and analyze high-frequency data streams gives traders an accurate and up-to-date view of market conditions—letting them keep pace with price, volume, and liquidity indicators across multiple venues and execute with optimal timing. Constant surveillance for sudden market movements or anomalies and the ability to optimize orders on-the-fly can also reduce risk in proprietary trading  
  • Smart order routing: Based on factors like price, liquidity, and fees, smart order routing can automatically direct trades to the best choice of venue at any given time. It’s also possible to spread orders across multiple venues to minimize the impact on market prices and further optimize execution  
  • Algorithmic trading: Along with enabling sub-second execution speeds and precise timing, algorithmic trading can also break down large orders into smaller batches to minimize market impact. Additionally, algorithmic trading models enable more advanced strategies that can adapt in real time to changing market conditions  

Crucially, these data-driven strategies also support the human side of the best execution equation, giving teams the granular insights needed to monitor performance, review issues, and test controls as per established policies and procedures.  

The analytics advantage  

When it comes to best execution, your engine room is data analytics. Advanced analytics power the informed choices and agile technologies you need to optimize alpha generation and maximize customer value, especially when leveraging high-frequency trading strategies. Two areas are especially relevant to best execution:  

  • Pre-trade analytics: Analyzing petabyte-scale datasets with microsecond latency, pre-trade analytics focus on optimizing future order performance by determining the best execution and risk management strategy. This might include complex simulations to assess the market impact of trades, improved transaction cost analysis to minimize fees or slippage, and leveraging real-time data feeds to optimize smart routing decisions. By fully documenting trading decisions, pre-trade analytics also strengthens compliance and operational efficiency  
  • Post-trade analytics: Best execution is a continuous challenge that demands constant effort. By calculating metrics like effective spread and implementation shortfall, post-trade analytics can benchmark performance against various indices and highlight areas for improvement. Evaluating past trades at a granular level produces vital insights that can help fine-tune strategies for optimal customer value, as well as improve internal risk management  

Together, pre- and post-trade analytics offer a powerful solution for achieving best execution—enabling firms to optimize and refine trading strategies and enhance operational efficiency despite increasing compliance demands.  

Stacking up for best execution success  

By integrating real-time feeds from exchanges, financial institutions, and other data providers, trading desks can execute faster than competitors and deliver better outcomes. However, extracting actionable insights from petabyte-level data fast enough to power moment-to-moment algorithmic or high-frequency trading is no easy task.  

A high-performance analytics stack is crucial to capitalize on streaming data by making it fast and easy to load, transform, query, or visualize enormous datasets to find patterns or anomalies. With the ability to ingest large volumes of information, process it in milliseconds, and offer very low-latency response times, a highly performant solution enables your traders to react rapidly to market movements or predict likely outcomes, continuously adjusting orders to ensure best execution.  

Such high-speed analytics can also help maintain the real-time records demanded by industry regulations and provide an auditable trail that proves best execution, minimizing the cost of compliance and maintaining operational efficiency. Additionally, streaming analytics can drive continuous trade surveillance, detecting major violations like front-running or churning in real time for even greater peace of mind.  

How can KX support with best execution

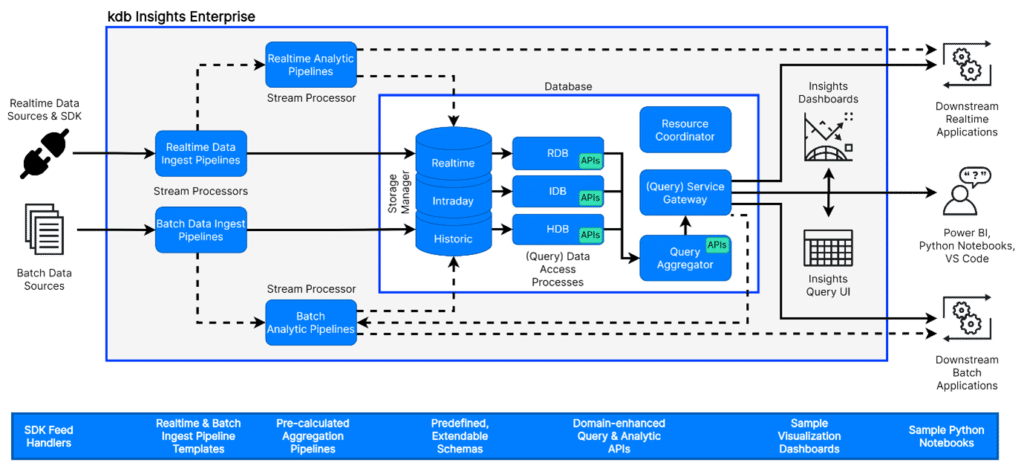
KX helps you meet best execution requirements while turning regulatory obligations into opportunities. Our high-performance database, kdb+, enables real-time analytics and smarter trading decisions. With kdb Insights Enterprise, gain fast query speeds, intuitive tools, and robust reporting for data-driven compliance. 

Learn more by watching our webinar with ICE and ExeQution Analytics and learn ‘Six best practices for optimizing trade execution.’  

We are here to support you as market complexity and best execution requirements grow, arming you with the advanced technology you need to stay in compliance and ahead of competitors.  Learn more about how our solutions enhance pre- and post-trade analytics, or book a demo to see our capabilities in action. 

Supercharging your quants with real-time analytics

KX recognized as ‘Best Transaction Cost Analysis Solution for Best Execution’

With the ever-increasing volatility of financial markets and the multitude of trading venues resulting from market fragmentation, Transaction Cost Analysis (TCA) has become an essential function that broker-dealers are expected to provide. As regulatory demands rise and trading complexity grows, TCA solutions are critical in helping firms assess transaction costs, adjust strategies in real time and drive improved outcomes across equity and market data analysis.

We’re pleased to announce that KX has been recognized as the ‘Best Transaction Cost Analysis Solution for Best Execution’ in A-Team Group’s RegTech Insight Awards USA 2024. Determined by industry votes and client feedback, this award reflects KX’s commitment to delivering innovative, high-performance solutions that empower financial institutions to meet regulatory requirements and optimize transaction outcomes in a complex market environment.

The RegTech Insight Awards are widely respected in the financial industry, celebrating established providers and innovative newcomers who excel in providing essential regulatory technology solutions across the global financial services industry. This recognition underscores the impact of KX’s TCA capabilities, which empower clients to achieve efficient and transparent execution across their trading activities.

Empowering capital markets with kdb Insights Enterprise

For over three decades, KX has delivered exceptional value to top investment banks and hedge funds with a focus on equity trading and market data analysis. Building on this legacy, we developed kdb Insights Enterprise. This cloud-native, high-performance analytics platform is purpose-built for the real-time analysis of streaming and historical data in capital markets.

The platform simplifies the creation of dynamic visualizations and reports, supporting critical functions like TCA and Execution Analytics. By integrating data pipelines from various sources, including liquidity ventures and order book data, kdb Insights Enterprise enables firms to perform comprehensive, real-time analyses that drive better trading outcomes.

Key capabilities of kdb Insights Enterprise include:

  • Optimizing trading outcomes: With high-speed data ingestion and processing, kdb Insights Enterprise empowers firms to refine algorithmic strategies in real time and maximize trading performance.
  • Demonstrating execution quality: The platform delivers comprehensive, data-driven evidence to support data scientists and electronic traders in consistently proving ‘best execution.’
  • Supporting scalability and efficiency: Built on the powerful kdb+ time-series database, kdb Insights Enterprise scales effortlessly to handle high data volumes, reducing the need for extensive hardware and lowering the total cost of ownership (TCO).

Through these capabilities, kdb Insights Enterprise is a versatile analytics platform, equipping financial institutions to handle today’s dynamic trading environment with speed, transparency, and precision.

Driving innovation in financial analytics

As financial markets continue to evolve, KX remains committed to pushing the boundaries of data analytics and performance for capital markets. Our relentless focus on innovation ensures that our clients are equipped with the most powerful tools to manage market volatility, optimize trading outcomes, and meet complex regulatory requirements.

We’re honored by this recognition from the RegTech Insight Awards and look forward to building on this success as we advance our mission to deliver industry-leading data solutions to the financial services sector.

View the full list of RegTech Insight Awards USA 2024 winners.

Learn more about our latest updates to the kdb Insights Portfolio

Webinar: Six best practices for optimizing trade execution

In our latest webinar, Leon Liang from ICE, Feargal Murphy from KX, and Cat Turley from ExeQution Analytics explore best practices for optimizing trade execution, sharing critical strategies and real-world solutions that leading firms are using to turn transaction cost analysis (TCA) into a powerful driver of trade performance and risk management. 

Success in the financial markets depends on speed, precision, and the ability to draw actionable insights from vast datasets in real time.  

Trade execution – the process of buying and selling securities on behalf of clients or for proprietary trading – is increasingly under scrutiny as firms seek to optimize every aspect of performance. For many, this process goes beyond simply managing costs; it’s about capturing alpha, ensuring compliance, and enhancing decision-making with unparalleled precision. Yet, achieving this level of sophistication requires you to redefine your approach.

Historically, TCA has focused on regulatory compliance, serving as a box-ticking exercise rather than a tool for actionable insights. But as our experts from ICE, KX, and ExeQution Analytics highlight in this session, TCA can – and should – be a robust framework for continuous improvement and real-time decision-making.  

Watch the full session here or browse the key takeaways below: 

1. Redefining trade cost analysis with real insights 

Cat Turley highlights that while TCA has traditionally been a compliance exercise, reframing it as ‘trade research’ can yield actionable insights. “The term ‘research’ implies learning and continuous improvement, transforming TCA from a box-ticking exercise to a tool for real performance enhancement,” she explains. This shift is essential for firms looking to optimize trading decisions beyond mere regulatory requirements. 

2. Leveraging real-time data for competitive edge in trade execution

Fergal Murphy underscores the critical role of real-time data in capital markets, describing KX’s platform as the leader in time-series analytics, essential for front-office applications. “Our platform’s low latency and ability to handle high-frequency data at scale make it indispensable for pre- and post-trade analytics, backtesting, and quantitative research,” Murphy states. The discussion highlights how KX enables firms to make in-the-moment decisions, critical in fast-paced trading environments. 

3. Data integration and flexibility are key to effective analytics 

Integrating diverse datasets quickly is often a bottleneck in TCA. Leon Liang notes that ICE’s vast data sets, combined with KX’s powerful data ingestion capabilities, enable the rapid building of a comprehensive trade model. By pairing ICE’s quantitative datasets with KX’s platform, users can rapidly test scenarios and refine strategies, reducing trade execution lead times. 

4. Reducing the complexity of TCA for scalable implementation 

Many firms struggle to balance the complexity of TCA processes with the need for speed and accuracy. Turley explains that ExeQution Analytics specializes in simplifying data workflows, helping firms integrate market and trading data seamlessly. This approach empowers firms to “access the value of TCA in near real-time,” avoiding analysis delays that can impact strategic outcomes. 

5. Building a data-driven culture for long-term success 

Leon Liang and Fergal Murphy emphasize the importance of embedding data and analytics into the organizational culture. Murphy points out that KX’s solutions enable firms to streamline data operations, providing “actionable insights to inform strategic decisions and reduce risks” at a scalable level. For firms aiming to become ‘AI-first’, these tools foster an environment where data-led decision-making becomes the norm. 

6. A roadmap to advanced trading analytics with KX and ICE 

The webinar concludes with a roadmap for leveraging KX and ICE solutions in trade execution optimization. By adopting an integrated approach with real-time analytics and a flexible data environment, firms can build a more responsive and efficient trading ecosystem. According to Murphy, “Our combined capabilities allow traders to gain insights at every stage of the trade lifecycle, from pre-trade research to post-trade performance analysis”. 

Learn how KX can help enhance trade execution quality, manage risk and improve decision-making with pre-trade analytics and post-trade analytics. Discover how KX and ICE are empowering traders and portfolio managers to improve decision-making, operational efficiency and trading practices with our Fixed Income Accelerators.

投稿が見つかりませんでした。

Climbing the crowded mountain: Generating alpha with high-performance analytics 

Capital markets are more competitive than ever, with quantitative researchers and analysts from leading firms all climbing the same mountain to find innovative ways of generating alpha. This blog explores the role that high-performance data analytics plays in helping these climbers reach the summit faster than their competitors. 

When Sir Edmund Hillary attained the summit of Everest in 1953, he became the first person to reach the highest point on Earth, succeeding where almost a dozen well-funded expeditions had failed. Yet, seven decades later, hundreds of tourists make the same ascent each year—thanks to a potent combination of better knowledge and technology. 

Himalayan mountains and valleys may differ significantly from the peaks and troughs of financial markets, but your trading desks face a similar problem in today’s search for profit, or ‘alpha’. Like the summit of Everest, markets are more crowded than ever—and traditional capabilities no longer leave you far above the competition. 

Not only have today’s market participants learned from the hard-won strategies of others, but advancing technology also means it’s easier for them to deploy sophisticated models, algorithms, and other capabilities that only the most prominent firms possessed just a decade or two ago. 

While finding a competitive edge is more complicated than ever, capital markets are also much more complex today. It’s not just the worldwide scope, multiplying financial instruments, or growing regulation; constant connectivity and business digitization mean the sheer variety, volume, and velocity of relevant data can be overwhelming. 

But it can also be a source of advantage. 

Read on as we explore how high-performance data analytics can optimize the ideation and execution of trading strategies, accelerate alpha generation, and sharpen your competitive edge. 

In this hyper-competitive environment, innovation is vital to consistent alpha generation—and the ability to drink from today’s firehose of data holds the key. 

Drinking from the firehose 

Information now flows at the speed of thought around the world, making modern capital markets much more efficient. 

With ubiquitous automation and high-frequency trading, markets react faster than ever, reducing the window for adjustments. Market participants can also identify inefficiencies more swiftly, making it increasingly challenging to uncover untapped opportunities for exploitation. 

In this hyper-competitive environment, innovation is vital to consistent alpha generation—and the ability to drink from today’s firehose of data holds the key. 

When your teams can harness high-performance analytics to process, integrate, and evaluate a staggering array of data in real time, they can access vital insights and make the best possible choices when seeking alpha. Beyond enabling more effective execution, highly performant analytics also slashes the time it takes to develop new and improved trading strategies—allowing you to iterate models and deploy ideas faster than competitors. 

But it’s no easy task. Extracting meaningful insights from petabyte-scale data fast enough to drive moment-to-moment trading decisions is a big challenge. 

Leveraging high-performance data analytics 

Effective data analytics comes down to scale, speed, and depth of insight. Here are some must-have considerations for any advanced analytics platform. 

Real-time processing… 

Your quants and traders need access to high-quality real-time data for the most accurate and up-to-date view of market conditions. 

By ingesting large volumes of streaming data from diverse inputs and processing it in milliseconds, high-performance analytics makes it quicker and easier to identify patterns or anomalies and make fast, informed decisions based on market signals. But that alone isn’t enough. 

…enriched with historical data 

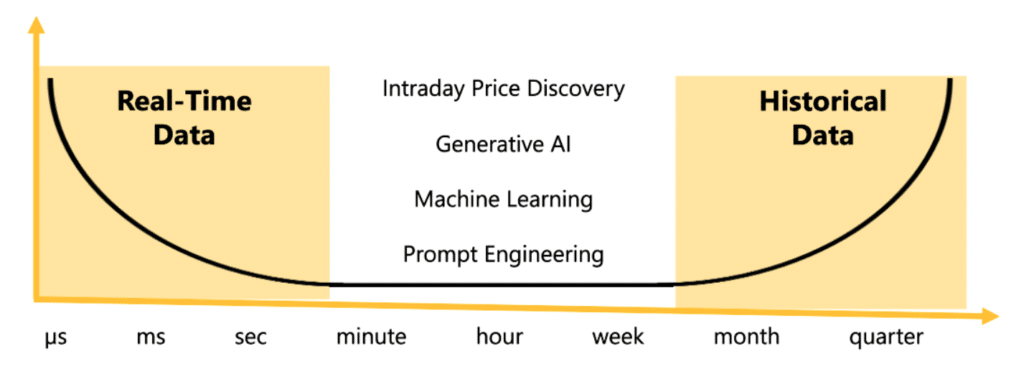
To drive critical, in-the-moment decisions, a top-performing analytics stack also needs to fuse streaming market data with historical information at speed and scale. 

Historical information is vital to contextualize financial data—giving traders better visibility into market risks or opportunities and empowering them to backtest strategies robustly. 

Time-series support 

Time-series databases are designed to handle high-frequency, high-volume information streams, capturing the chronological flow and interdependent nature of market events. 

By ensuring your analytics stack supports time-series data capture and low-latency processing, your quants can harness granular insights into market behavior and trends over time—detecting anomalies, finding patterns, and enabling predictive modeling by comparing similar situations from the past. 

Comprehensive data integration 

Beyond processing real-time, historical, and time-series data, high-performance analytics must also handle varied data sources and make it easy to load, transform, query, or visualize massive datasets. 

To create a holistic view of the market, you need access to structured information, like price and volume feeds, and unstructured data, like documents, images, or videos. 

While structured data has long been the backbone of algorithmic trading, finding connections with unstructured data can yield deeper insights and new opportunities for alpha generation. Read Mark Palmer’s blog, “The New Dynamic Data Duo”, to learn more. 

Data cleansing 

Whatever markets you’re trading, don’t forget the importance of high-quality data. Early validation is critical, ensuring that inaccurate or duplicate data is identified as soon as it enters the system. This prevents flawed data from affecting downstream analytics. 

Normalization plays an equally important role, as data from multiple sources—market feeds, platforms, and internal systems—often comes in various formats. Consistent data structures allow for seamless integration and more reliable insights. 

Real-time data integrity checks ensure that only accurate, complete, and reliable data informs trading models. For firms handling large volumes of data, ensure you invest in an analytics solution offering high-speed validation, normalization, and integrity checks built for the scale and complexity of capital markets. 

AI and machine learning 

Markets don’t wait, so crunching petabyte-scale data for actionable insights must happen quickly. As such, high-performance data analytics platforms increasingly leverage complex algorithms and AI and machine learning to help traders detect hard-to-see patterns, automatically refine strategies, or drive ideation. 

In a recent survey by Mercer, around 91% of investment managers said they are using or plan to use AI in their investment processes. 

Scalability 

Finally, don’t forget the importance of scalability and flexibility. Any analytics solution should be able to grow with your needs as trading operations and data volumes rise, scaling up both compute and storage as required to prevent performance degradation. 

Whatever markets you’re trading, don’t forget the importance of high-quality data. Early validation is critical, ensuring that inaccurate or duplicate data is identified as soon as it enters the system. This prevents flawed data from affecting downstream analytics. 

The future of alpha 

Techniques for generating alpha have come a long way, but innovation in capital markets is only accelerating. 

Emerging technologies are transforming what data analytics can do, letting traders harness more information than ever, create unimaginable insight, and make hyper-accurate market forecasts. 

Here are three areas to consider as you plan for the future. 

Generative AI (GenAI) 

Progress in GenAI enables ever-faster analytics and the ability to ingest and process more extensive and varied datasets for richer insights. 

Many capital market firms are already becoming ‘AI-first’ enterprises, making AI a core component of their culture, infrastructure, and decision-making to drive innovation and competitive advantage. Almost two-thirds of organizations surveyed by Bain & Company in 2024 cite GenAI as a top three priority over the next two years. The McKinsey Global Institute also estimates that GenAI can offer $200-340 billion in annual value for the banking sector. 

While real-time data and time-series analysis remain critical for responsive decision-making, the integration of GenAI will supercharge the performance of models and analytics, while reducing complexity and cost. 

However, the most significant value will be leveraging the full spectrum of traditional and emerging AI capabilities to create new connections and generate fresh ideas.  

Unlocking the value of alternative data 

The more data you have, the more it compounds in value. Actionable insights come from finding links, correlations, and patterns. 

We’ve already covered the benefits of adding unstructured datasets like call transcripts or analyst reports—but they are challenging to ingest, process, and interrogate for helpful information. However, that’s changing. 

Gaining insights from an even wider range of alternative data sources is becoming faster, cheaper, and easier thanks to advances in large language models (LLMs) and vector databases. While LLMs provide the ability to analyze and understand a considerable volume of unstructured data, for instance through intelligent document processing, vector databases also enable real-time querying and retrieval

The ability to tap into much more varied forms of unstructured data will fuel an analytics revolution, enhancing your ability to find unique and unexpected insights that were previously invisible. 

Data inputs spanning everything from social media sentiment, web traffic, and geolocation data to weather patterns and satellite images will soon be a mainstay of competitive advantage. 

According to a report from the Alternative Investment Management Association, nearly 70% of leading hedge funds are already using alternative data in their quest for alpha.  Meanwhile, Deloitte forecasts that the market for alternative data will be larger than that for traditional financial information by 2029. 

Advanced predictive analytics 

AI-powered predictive analytics using vast real-time, time-series, and historical datasets will strengthen the ability of trading desks to foresee market movements or broader trends. This will enable more informed, proactive decisions—capitalizing on emerging opportunities and significantly reducing the risk from unexpected events. 

But remember, feeding AI the wrong data will give you incorrect predictions. You need clean, trustworthy data–in vector form–to train accurate and efficient AI models. 

In this webinar, we explored Wall Street’s leading-edge applications of high-frequency data in quantitative trading.

Staying ahead of the curve 

As innovation accelerates, it’s crucial to prepare for tomorrow’s capabilities today. If you don’t have a technology stack that’s optimized for high-performance analytics, now’s the time to focus on this vital element in your quest for alpha. 

You don’t invest in technology for technology’s sake—so aligning strategies for data analytics with key business goals and specific pain points is crucial. It all comes down to six letters: TCO and ROI. 

If you’re currently depending on a patchwork of legacy systems, don’t accept the combination of higher infrastructure costs and slower analytics that causes you to miss out on alpha-generating opportunities. 

To support ongoing innovation, look for analytics platforms that are easy to deploy and can flexibly integrate with new technologies as they appear. It’s vital to stay current on emerging trends and continuously refine your approach to keep pace with what’s possible. 

You may not be scaling Everest, but make no mistake, the race to the top has started. Data is exploding in complexity and volume, system capabilities are increasing, and your competitors are already exploring new capabilities. 

Optimize your trading strategies with kdb Insights Enterprise, built for real-time, high-performance analytics. Discover how we help quantitative researchers rapidly test models and analyze vast data sets to stay ahead of market movements. Learn more about how KX is powering the future of quantitative research here 

投稿が見つかりませんでした。

KX Community Grows with Thousands of Members Empowers Developers to Solve High-Frequency Large-Volume Data Challenges for AI and Analytics Applications

KX, a global leader in vector-based and time-series data management, has added thousands of members within the KX Community, emphasizing the growing need for developer friendly education and tools that address high-frequency and large-volume data challenges across structured and unstructured data. Spearheaded by KX’s developer advocacy program, the community increases year-to-year since its inception in January 2022. This growth reflects KX’s commitment to supporting both its long-standing Capital Markets customers and the wider developer community, empowering developers to solve complex, real-world problems in building AI and analytics applications. To complement this initiative, KX has launched KXperts, a developer advocacy program that enables members to deepen their involvement and engage in thought leadership, collaboration and innovation.

“The developer experience is a core tenant of KX’s culture. We seek opportunities to deepen our connection with the developer community so we can provide a product and environment that delivers ongoing value,” said Neil Kanungo, VP of Product-Led Growth at KX. “The growth of our member base and the increasing engagement of KXperts illustrates that the developers within the builder community are eager to lead, contribute and mentor. We’re proud to provide an open, collaborative environment where developers can grow and work together to solve business challenges more effectively.”

The KX Community serves as a platform for a wide range of technical professionals, including data engineers, quants and data scientists, to engage in impactful projects and dialogue that support the growth of members, both personally and professionally, as well as influence the broader market. Community members have increasingly leveraged the uniquely elegant q programming language, and, most recently, PyKX, which brings together Python’s data science ecosystem and the power of KX’s time-series analytics and data processing speed. Over 5,000 developers download PyKX daily. The Visual Studio Code extension, that enables programmers to develop and maintain kdb data analytics applications with the popular VS Code IDE, brings a familiar development flow to users, allowing them to adopt KX technology quickly and seamlessly. Combined, these tools improve the accessibility of KX products, making it easier for members to solve complex, real-time data challenges in a multitude of industries, including Capital Markets, Aerospace and Defense, Hi-Tech Manufacturing, and Healthcare.

The newly launched KXperts program is a unique subcommunity of developer experts who are advocates for KX’s tools and technology. Members of the program unlock opportunities to contribute their expertise to technical content development, research, and events, and provide product feedback that informs KX’s research and development initiatives. Members receive the following benefits:

  • KX Academy – Access to tutorials and educational courses that enable users to become technically proficient in KX architecture, q programming language, PyKX, SQL for kdb, KX Dashboards and the entire KX product suite. By the end of 2024, KX will have released six new free educational courses with certifications, bringing the total to over a dozen.
  • Sandbox Environment – Enables members to trial most KX products and complete exercises, honing their skills and better familiarizing themselves with new product updates without the friction of upgrades or installations.
  • Programming Tools – Developers can utilize KX’s Visual Studio Code extension and PyKX, which is available through popular open-source channels, to achieve flexibility of programming in either Python or q. These tools improve the developer experience by making KX products more intuitive, easier to use, and accessible.
  • Slack Community – Moderated by KX’s in-house developers, this free Slack community connects members with experts and peers who are available to answer questions and engage in meaningful conversations.

“Those of us within the KXperts program are extremely passionate about the work we do every day and are motivated to further our engagement within the broader developer community,” said Alexander Unterrainer, with DefconQ, a kdb/q education blog. “Since becoming a member, I’ve had the opportunity to participate in speaking engagements alongside the KX team, and share my advice, experience and perspectives with a larger audience than I had access to prior.”

“Since I began my kdb journey, I’ve sought opportunities to share the lessons I’ve learned with others in the community. KX has supported this since day one,” said Jemima Morrish, a junior kdb developer at SRC UK. “Upon becoming a member of KXperts a couple months ago, I’ve been able to refine my channel so that I can serve more like a mentor for other young developers just kickstarting their career journeys. Helping them learn and grow has been the most fulfilling benefit.”

“I have become extremely proficient in the q programming language and kdb+ architecture thanks to the resources available from KX,” said Jesús López-González, VP Research at Habla Computing and a member of KXperts. “I’ve also had the opportunity to produce technical content hosted within the KX platform, and lead meetups, better known as ‘Everything Everywhere All With kdb/q,’ where I’ve contributed guidance to KX implementation and how to use the platform to address common challenges.”

The robust, active community is an added benefit to business leaders who prioritize onboarding technical solutions that support their development teams in streamlined onboarding of technology and continued advancement and proficiency. While the community continues to reach new growth milestones, this marks a significant step forward in the company’s efforts to scale and reach new developers, positioning KX as an increasingly accessible and open platform.

Register for the KX Community, apply for the KXperts program or join the Slack Community to start your involvement with the growing developer member base.

To learn more about all resources available to the developer community, please visit the Developer Center: https://kx.com/developer/

What’s new with Insights 1.11

The Insights Portfolio brings the small but mighty kdb+ engine to customers who want to perform real-time streaming and historical data analyses. Available as either an SDK (Software Development Kit) or a fully integrated analytics platform, it helps users make intelligent decisions in some of the world’s most demanding data environments.

In our latest release, Insights 1.11, KX introduces a selection of new feature updates designed to improve the user experience, platform security, and overall query efficiency.

Let’s explore.

We will begin with the user experience updates, which include several new features:

  • Data flow observability accelerates root cause analysis for data pipeline errors by providing enhanced visibility into data ingestion so that developers can quickly identify and trace issues without having to interrogate multiple service logs
  • Client replica size discovery for Reliable Transport simplifies connections and configurations by including automatic discovery of the cluster size, removing the need for manual configurations and client-side topic prefixes
  • User Defined Analytics (UDA) have been consolidated into a single, unified API, eliminating the need for detailed system knowledge and API functionality across components.
  • PDF generation for views and UI enhancements, including “Dark Mode,” has now been added to the Insights UI. We have also optimized the scratchpad experience to improve responsiveness and reduce system load
  • HTTP proxy support now provides seamless integration for customers, ensuring accurate traffic routing and reliable pipeline deployments

Security enhancements include:

  • Encryption for “Data At REST” adds the ability to encrypt all tables in the intraday and historical databases using kdb+’s native DARE capability. When enabled, Advanced Encryption Standard with 256-bit Cipher Block Chaining is used to provide symmetric key encryption for secure workstreams
  • Package entitlements enable safe multi-user deployments by securing the creation of user-defined packages via the Command Line Interface (CLI). This helps secure collaboration by protecting deployments and analytics from unauthorized access or changes.
  • jQuery and jQueryUI have also migrated to newer technologies in 3D charting and dashboards, addressing potential vulnerabilities related to cross-site scripting (XSS) and DOM manipulation found during penetration testing

Finally, we have made several feature updates to overall query efficiency, including:

  • Live rolling view states for temporal data, enabling end users to provide relative timestamps in data source queries and execute at dashboard load of configured polling intervals
  • Limits to getData queries also accelerate reliable query response on larger datasets by enabling analysts to retrieve just a subset of the data (for example, the top 100 rows)

To learn more, visit our latest release notes and explore our free trial options.

投稿が見つかりませんでした。

Mastering fixed income trading with ICE accelerators on kdb Insights Enterprise

Professionals working in the fixed-income trading and portfolio management space know that maintaining a competitive edge demands near instant access to high-frequency data and the ability to swiftly and precisely interpret it.

Traditional methods are becoming inefficient due to increasing data volume complexities, which lead to decision-making hurdles for both traders and portfolio managers.

The challenge

In the recent Fixed Income Leaders Summit, experts highlighted the growing correlation between credit markets and listed cash markets, arguing that traders now need to consider both underlying securities and treasury futures when trading bonds.

On top of this, organizations are shifting from recruiting large trading teams in favour of technical specialists and compact, highly competent teams to manage data and construct models.

Tied in with the operational challenges of managing multiple data pipelines, financial firms are now looking for ways to streamline and simplify processes.

The solution

Working in association with Intercontinental Exchanges (ICE), KX are pleased to introduce the “Fixed income accelerator” designed to ingest real-time, historic, and reference data from ICE’s fixed income data services for analysis in kdb Insights Enterprise.

Eliminating the need to manually configure the infrastructure, deployment times are significantly reduced, allowing tick-level data to be streamed in real-time via custom analytic pipelines that can be queried using industry standard tooling such as SQL, Python and q.

Features include

  • Integration with ICE’s extensive data sets, including interest rates, bonds, and related indices
  • Advanced tools for spread, treasury analysis, sector comparisons, and ratings for detailed market insight
  • Reduced model development times to accelerate decision-making
  • Friendly user interface that provides easy access to queries and visualizations
  • Scalability to support dynamic analytical needs and the consolidation of intricate data sources

We believe that these features will significantly improve decision-making, operational efficiency and trading practices, empowering traders and portfolio managers to act faster with decisions that shift from traditional screen-based trading to model-based approaches that align with market trend.

Find out more by visiting our documentation site or contact sales for further details

Book a Demo Azure

Demo the world’s fastest database for vector, time-series, and real-time analytics

Start your journey to becoming an AI-first enterprise with 100x* more performant data and MLOps pipelines. 

kdb Insights Enterprise on Microsoft Azure is ideal for scalable quant research in the cloud and supports SQL and Python with unparalleled speed. Data-driven organizations choosing KX for faster decision making:

Book your personal demo


    By submitting this form, you will also receive sales and/or marketing communications on KX products, services, news and events. You can unsubscribe from receiving communications by visiting our Privacy Policy. You can find further information on how we collect and use your personal data in our Privacy Policy.

    *required

    A Verified G2 Leader for Time-Series Vector Databases

    4.8/5 Star Rating

    G2 Stars - KX
    G2 Stars - KX
    G2 Stars - KX
    G2 Stars - KX
    G2 Stars - KX

    Based on time-series queries running in real-world use cases on customer environments.

    To see how kdb performed in independent benchmarks that show similar on replicable data see: TSBS 2023STAC-M3DBOps, and Imperial College London Results for High-performance DB benchmarks.

    The ultimate guide to choosing embedding models for AI applications

    Backtesting at scale with highly performant data analytics

    Speed and accuracy are crucial when backtesting trading strategies.

    To gain the edge over your competitors, your data analytics systems must ingest huge volumes of data, with minimal latency, and seamlessly integrate with alternative data sources.

    This blog identifies the essential components you should consider to optimize your analytics tech stack and incorporate emerging technologies (like GenAI) to enhance backtesting at scale.

    Key considerations for effective backtesting data analytics

    When you backtest, you’re using your data analytics stack to create a digital twin of the markets within a ‘sandbox’.

    By applying a set of rules to real-world, historical market data, you can evaluate how a trading strategy would have performed within a risk-free testing ground. The more performant this testing ground is, the less time it takes to develop new and improved trading strategies, allowing you to iterate and deploy your ideas faster than your competitors.

    But how do you ensure your backtesting tech stack can operate at the speed and scale you need to be successful? Here, we’ll dig a little deeper into these essential components of effective backtesting.

    The key considerations are:

    Data quality and management: Access to high quality historical data from a reputable source is essential for backtesting at scale. Focus on data aggregation, quality controls, and structured data to improve the speed and ease of retrieving data. 

    Speed and efficiency: Speed and efficiency of your data analytics stack is crucial. Speed-to-insight is everything and any down time or latency can lead to missed opportunities and increased exposure to risk.

    User expertise:The effectiveness of your data analytics stack is also dependent on the expertise of the users and their understanding of the programming language on which your solution runs.

    Most importantly…

    Scalability and flexibility: Determining the viability of a trading strategy requires the ability to process petabyte-scale volumes of high-frequency data – sometimes handling billions of events per day. You then need to be able to run concurrent queries to continually fine tune parameters and run quicker simulations. Your chosen database and analytics tools should be scalable to handle all of this without sacrificing performance.

    By working with a platform that incorporates these essential features, you can run more informed simulations, more often. This shortens your time-to insight and enhances the level of confidence in your approach, obtaining accurate, empirical evidence that supports or opposes your strategies.

    Having highly performant data analytics technology is crucial, but success doesn’t stop there. To gain the insights you need to optimize trade execution and generate Alpha, you need a granular view, informed by both historical and real-time data.

    Fuse high-quality historical time series data with real-time data

    The biggest questions you face while backtesting require context, which is why high-quality historical data, from a reputable source, is vital. However, for a backtest to be valuable, it must also be timely and accurate. The accuracy is impacted by the realism of the backtest, which means the simulation must reflect real-world conditions.

    Processing high-frequency market data for low-latency decision making requires the fusion of a real-time view of the market with the ability to put conditions into historical context quickly.
    Processing high-frequency market data for low-latency decision making requires the fusion of a real-time view of the market with the ability to put conditions into historical context quickly.

    You need massive amounts of historical data applied to real-time streaming data to accomplish this. Think of it like the human body’s nervous system. Real-time streaming data provides the sensory input. However, we require the accumulated history of whether that input means danger or opportunity to put the situation in perspective and make effective judgements.

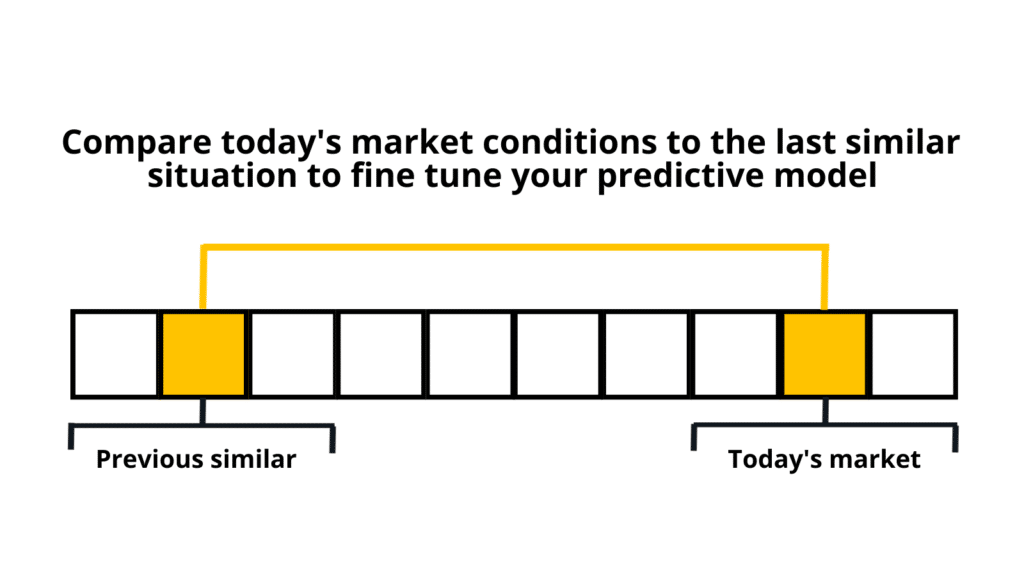
    Compare today’s market conditions to the last similar situation to fine-tune predictive model​
    A time series database is like a video replay for market data that quants can use to analyze markets (e.g.,AS-IF)

    The key is a high-performance system that allow you to test more quickly and accurately than your competition. By combining real-time streaming data with a time-series view of historical data, you can backtest your strategies against past market conditions, assessing their viability against previous trends and behaviours.

    Find this balance when you backtest by leveraging a database that makes it easy to combine high-frequency, real-time data and temporal, historical data in one place. This allows applications to perform tick-level “as-if” analysis to compare current conditions to the past and make smarter intraday backtesting decisions.

    Real-time and historical time series aren’t the only two data types you can fuse together to enhance your analytics…

    Backtesting with GenAI: Combining structured and unstructured data

    Structured data has long been utilized in algorithmic trading to predict market movements. However, advancements in GenAI are making it easier and more cost effective to process unstructured data (PDF documents, web pages, image/video/audio files, etc.) for vector-based analysis.

    Combining these types of data in the backtesting process is providing new opportunities to gain an analytics edge (Read “The new dynamic data duo” from Mark Palmer for a more detailed explanation).

    These types of applications require data management systems to connect and combine unstructured with structured data via vector embeddings, synthetic data sources, and data warehouses to help prepare data for analysis. For example, new KX capabilities enable the generation of vector embeddings on unstructured documents, making them available for real-time queries.  

    Using LLMs to merge structured market data with unstructured sources such as SEC filings and social media sentiment means you can generate queries that not only assess how your portfolio has performed, but why it performed that way.

    Combining structured and unstructured data marries accuracy with serendipitous discovery. It provides more expansive and specific insights.

    For example, let’s assume a series of trades haven’t performed as well as expected. Your system can use its access to news outlets, social media sentiment, and other unstructured sources to attribute the downturn to broad factors such as market instability, specific corporate developments, and currency shifts, offering a more detailed perspective on potential causes for the underperformance.

    The combination of structured and unstructured data represents a revolutionary step in data analytics, enhancing your ability to backtest with unique insights that were previously hidden.

    Backtesting at scale: wrapped up

    If you want to assess the viability and effectiveness of your trading hypotheses and get watertight strategies to market faster than competitors, then you need a highly performant analytics platform.

    To backtest at scale, your analytics platform should offer speed, scalability, and efficient data management. It must also support multiple data sources and enable the comprehensive testing of complex trading strategies.

    One such platform is kdb Insights Enterprise, a cloud-native, high-performance, and scalable analytics solution for real-time analysis of streaming and historical data. Ideal for quants and data scientists, Insights Enterprise delivers fast time-to-value, works straight out of the box, and will grow with your needs.

    Discover how KX will help you accelerate backtesting so you can rapidly validate and optimize your trading strategies at scale here.

    Read more about kdb Insights Enterprise here or book your demo today.

    Get started with kdb Insights 1.10

    The kdb Insights portfolio brings the small but mighty kdb+ engine to customers wanting to perform real-time analysis of streaming and historical data. Available as either an SDK (Software Development Kit) or fully integrated analytics platform it helps users make intelligent decisions in some of the world’s most demanding data environments.

    In our latest update, kdb Insights 1.10, KX have introduced a selection of new features designed to simplify system administration and resource consumption.

    Let’s explore.

    New Features

    Working with joins in SQL2: You can now combine multiple tables/dictionaries natively within the kdb Insights query architecture using joins, including INNER, LEFT, RIGHT, FULL, and CROSS.

    Learn how to work with joins in SQL2

    Implementing standardized auditing: To enhance system security and event accountability, standardized auditing has been introduced. This feature ensures every action is tracked and recorded.

    Learn how to implement auditing in kdb Insights

    Inject environment variables into packages: Administrators can now inject environment variables into both the database and pipelines at runtime.. Variables can be set globally or per component and are applicable for custom analytics through global settings.

    Learn more about packages in kdb Insights

    kxi-python now supports publish, query and execution of custom APIs: The Python interface, kxi-python has been extended to allow for publishing and now supports the execution of custom APIs against deployment. This significantly improves efficiency and streamlines workflows.

    Learn how to publish, query and execute custom APIs with kxi-python

    Publishing to Reliable Transport (RT) using the CLI: Developers can now use kxi-python to publish ad-hoc messages to the Insights database via Reliable Transport. This ensures reliable streaming of messages and replaces legacy tick architectures used in traditional kdb+ applications.

    Learn how to publish to Reliable Transport via the CLI

    Offsetting subscriptions in Reliable Transport (RT): We’ve introduced the ability for streams to specify offsets within Reliable Transport. This feature reduces consumption and enhances operational efficiency. Alternative Topologies also reduce ingress bandwidth by up to a third.

    Learn how to offset streams with Reliable Transport

    Monitoring schema conversion progress: Data engineers and developers now have visibility into the schema conversion process. This feature is especially useful for larger data sets, which typically require a considerable time to convert.

    Learn how to monitor schema conversion progress

    Utalizing getMeta descriptions: getMeta descriptions now include natural language descriptions of tables and columns, enabling users to attach and retrieve detailed descriptions of database structures.

    Learn how to utilize getMeta descriptions

    Try free for 7 days

    Feature Improvements

    In addition to these new features, our engineering teams have been busy working to improve existing components. For example: –

    • We’ve optimized getData for queries that span multiple partitions.
    • We’ve introduced REST filtering for time, minute, and time span fields
    • We’ve introduced End of Interval Memory Optimization to automatically clear large, splayed tables
    • We’ve updated the Service Gateway to support JSON responses over HTTP
    • We’ve introduced customizable polling frequency in File Watcher
    • We’ve updated the Stream Processor Kafka writer to support advanced configuration
    • We’ve introduced a “Max Rows” option in views to limit values returned
    • We’ve enabled the ability to query by selected columns in the UI Screen to reduce payload.

    To find out more, visit our latest release notes then get started by exploring our free trial options.

    投稿が見つかりませんでした。

    Benchmark Report – High Frequency Data Benchmarking Confirmation

    Your Report Awaits

    Please use this link at any time to access the report “Benchmark Report – High Frequency Data Benchmarking”.

    Demo the world’s fastest database for vector, time series and real-time analytics


      For information on how we collect and use your data, please see our privacy notice. By clicking “Download Now” you understand and accept the terms of the License Agreement and the Acceptable Use Policy.

      Benchmark Report: High-Frequency Data Benchmarking

      The misunderstood importance of high-fidelity data

      Why does the gentle crackle of a vinyl record hold such a special place in our hearts? Analog experiences remain highly valued for their quality and tangible feel. The vinyl record renaissance exemplifies this – in the age of music streaming, many still appreciate vinyl’s richer, more immersive experience. Sometimes, a slower, higher-fidelity analog format offers an essential counterpoint to our instant-everything culture. It connects us to a level of quality and experience that digital struggles to replicate. 

      High data fidelity is crucial in data analytics too – especially for applications that deal with high-frequency time series data streams. Yet technologists often dismiss tuning into streaming data because they “don’t need to make real-time automated decisions.”

      But they’re mistaken: rich, immersive, high-fidelity streaming data is for everyone. 

      Let’s explore the misunderstood importance in more detail, particularly in the context of market data and quantitative trading. 

      Understanding data fidelity 

      Data fidelity refers to the accuracy and completeness of data as it is captured and stored. Most companies “over-digest” data through down-sampling, complex transformations during ETL, summarization and aggregation, or statistical techniques. While these methods are sufficient to get a bird’s-eye view of activity—such as obtaining the close-of-day stock price—they fall short when rich, high-fidelity insight is required. 

      High-fidelity data management stores are in time-series order – meaning they are chronologically arranged within a sequence over time. This helps answer some of our most important questions about space, time, and order, and complements traditional, transactional data.

      High-fidelity data by example in quantitative trading 

      Consider the world of financial market data and quantitative trading. Stock prices fluctuate hundreds of thousands, or even millions, of times a day. For many applications, a summarized version of this data is adequate — the price at each minute, hour, or end of the day.  

      However, high-fidelity data is indispensable for analysts and algorithmic traders who need to understand micro-movements and develop sophisticated trading strategies. For example, high-fidelity data allows for tick-by-tick analysis, where every price change is recorded and analyzed.  

      This level of detail is crucial for understanding the nuances of stock movements and conducting AS-IF analysis, a term used in time-series data analytics to compare time windows. AS-IF analysis makes it easy to compare today’s market conditions to the last similar situation so that traders can fine-tune today’s predictive model and trading strategies. 

      Compare today’s market conditions to the last similar situation to fine-tune predictive model​

      For example, high-fidelity data is essential to AS-IF comparison for ‘pairs trading’, where the price movements of related stocks are analyzed. Pairs trading capitalizes on the principle that the prices of related stocks tend to move together. However, trading opportunities arise when these stocks deviate from their usual patterns. Identifying these opportunities requires a detailed, tick-by-tick record of stock movements and other market indicators. 

      Comparing different windows in time helps traders anticipate how today’s market conditions might play out and predict the best trading strategies to employ by understanding data movements from previous, similar periods. 

      Applications beyond finance 

      The need for high-fidelity data extends beyond financial markets:

      • For manufacturing applications involving the streaming of IoT (Internet of Things) sensor data, high-fidelity data can be crucial for diagnosing equipment failures. By replaying every sensor data change event, engineers can pinpoint the exact moment and cause of a failure 
      • In e-commerce, high-fidelity data can help understand customer behavior. By analyzing every click a user makes on their journey to checkout, businesses can identify where customers abandon their shopping carts, leading to more effective strategies for reducing cart abandonment rates 
      • In high-precision agricultural applications, drone and satellite imagery stream into the data analytics team. A high-fidelity view of data that overlays weather, soil quality, and irrigation, alongside imagery, can help industrialized agricultural teams analyze actions that optimize cost, safety, and yield.

      In essence, any application with access to time-series streaming data has applications that benefit from a high-fidelity way of looking at their data.  

      The business advantage of high-fidelity data 

      Most companies struggle to store and analyze high-fidelity data due to the limitations of traditional relational and NoSQL databases, which are not optimized for time series data. This is where time series databases excel. They’re designed to handle high-frequency, high-volume data streams, making them ideal for storing and analyzing high-fidelity tick data. 

      The applications of high-fidelity data are numerous and varied, spanning industries from finance to manufacturing to e-commerce. Specialized time series databases handle and analyze this type of data, which sets it apart from other database management platforms.  

      As part of your innovation portfolio, exploring the possibilities of storing and analyzing high-fidelity tick or time series data can yield game-changing insight.  

      In summary, high-fidelity data is a technical requirement and a strategic asset that can drive significant business value. Read our ebook: 7 innovative trading applications and 7 best practices you can steal, to discover how to drive innovation and value with real-time and historical data in capital markets.

      投稿が見つかりませんでした。

      Book a Demo AWS

      KX and AWS Logos - KX

      Demo the world’s fastest database for vector, time-series, and real-time analytics

      Start your journey to becoming an AI-first enterprise with 100x* more performant data and MLOps pipelines. 

      kdb Insights on AWS is ideal for scalable quant research in the cloud and supports SQL and Python with unparalleled speed. Seamless integration with AWS services, like Lambda, S3, and Redshift, empowers you to create a highly performant data analytics solution built for today’s cloud and hybrid ecosystems. Data-driven organizations choosing KX for faster decision making:

      Book your personal demo


        By submitting this form, you will also receive sales and/or marketing communications on KX products, services, news and events. You can unsubscribe from receiving communications by visiting our Privacy Policy. You can find further information on how we collect and use your personal data in our Privacy Policy.

        *required

        A Verified G2 Leader for Time-Series Vector Databases

        4.8/5 Star Rating

        G2 Stars - KX
        G2 Stars - KX
        G2 Stars - KX
        G2 Stars - KX
        G2 Stars - KX

        Based on time-series queries running in real-world use cases on customer environments.

        To see how kdb performed in independent benchmarks that show similar on replicable data see: TSBS 2023STAC-M3DBOps, and Imperial College London Results for High-performance DB benchmarks.

        Book a Demo

        Demo the world’s fastest database for vector, time-series, and real-time analytics

        Start your journey to becoming an AI-first enterprise with 100x* more performant data and MLOps pipelines. 

        Data-driven organizations trust KX for faster decision-making

        J.P. Morgan Logo
        Morgan Stanley
        UBS
        Syneos Health
        Medtronic
        ALPINE

        Book your personal demo


          このフォームを送信することで、KXの製品、サービス、ニュース、イベントに関するセールスおよび/またはマーケティング情報を受け取ることもできます。個人情報保護方針(Privacy Policy)をご覧になれば、配信を停止することができます。個人情報の収集および使用方法については、プライバシーポリシーをご覧ください。

          *必須

          A Verified G2 Leader for Time-Series Vector Databases

          4.8/5 Star Rating

          G2 Stars - KX
          G2 Stars - KX
          G2 Stars - KX
          G2 Stars - KX
          G2 Stars - KX

          Based on time-series queries running in real-world use cases on customer environments.

          To see how kdb performed in independent benchmarks that show similar on replicable data see: TSBS 2023STAC-M3DBOps, and Imperial College London Results for High-performance DB benchmarks.

          Structure, meet serendipity: Integrating structured and unstructured data for left- and right-brain decisions

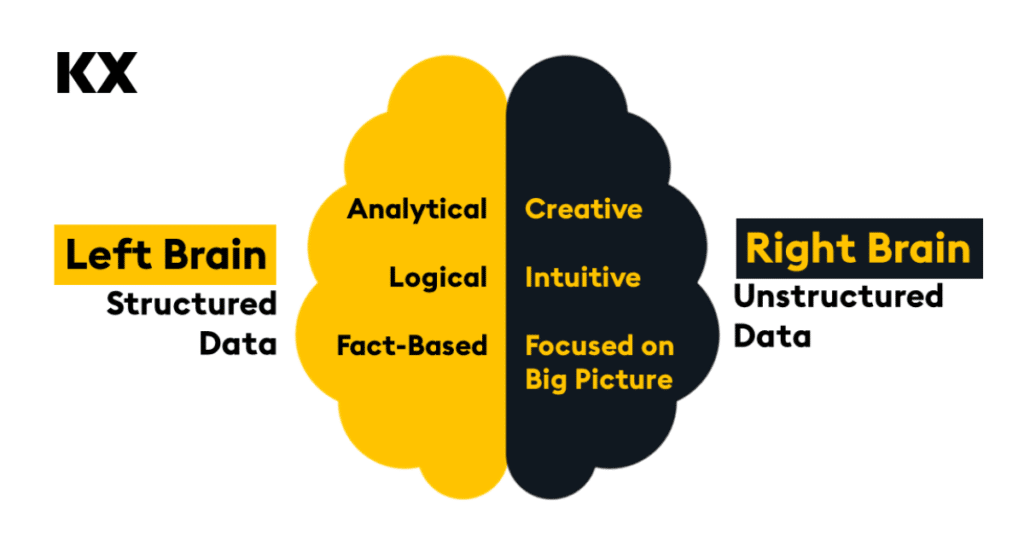
          Most technologists view using unstructured data (conversations, text, images, video) and LLMs as a surging wave of technology capabilities. But the truth is, it’s more than that: unstructured data adds an element of surprise and serendipity to using data. It decouples left—and right-brain thinking to improve insight generation and decision-making. 

          A recent MIT study points to the possibility of elevating analytics in this way. It observed 444 participants performing complex tasks associated with communicating key decisions like an analysis plan by a data scientist about how they plan to explore a dataset.  The study found that using GenAI increased speed by 44% and improved quality by 20%. The study shows that analysts, data scientists, and decision-makers of all kinds can use unstructured data and GenAI to elevate decision-making when they use unstructured and structured data. 

          This form of data-fueled decision-making combines the unstructured data required to power right-brain, creative, intuitive, big-picture thinking—with structured data for left-brain analytical, logical, and fact-based insight to inform balanced decision-making. 

          Here’s how it works. 

          Diagram comparing Structured Data to Left-Brain thinking and Unstructured Data to Right Brain thinking

          Unstructured data: A creative, intuitive, big-picture data copilot 

          Unstructured data powers creative, intuitive, big-picture thinking. Documents and videos are used to tell stories on a stream of consciousness. In contrast to structured data, it’s designed to unfold ideas in a serendipitous flow – a journey from point A to point B, with arcs, turns, and shifts in context. 

          Navigating unstructured data is similarly serendipitous. It matches how the brain processes fuzzy logic, relationships among ideas, and pattern-matching. The rise of LLMs and generative AI is largely because prompt-based exploration matches how our brains think about the world – you ask questions via prompts, and neural networks predict what might resolve your quandary.  Like your brain, neural networks help analyze the big picture, generate new ideas, and connect previously unconnected concepts. 

          This creative, right-brain computing style is modeled after how our brains work. Warren Mcculloch and Walter Pitts published the seminal paper in 1943 that theorized how computers might mimic our creative brains in A Logical Calculus of the Ideas Immanent in Nervous Activity. In it, they described computing that casts a “net” around data that forms a pattern and sparks creative insight in the human brain. They wrote: 

          “…Neural events and their relations can be treated using propositional logic. It is found that the behavior of every net can be described in these terms, with the addition of more complicated logical means for nets containing circles, and that for any logical expression satisfying certain conditions, one can find a net behaving in the fashion it describes.” 

          Eighty years later, neural networks are the foundation of generative AI and machine learning. They create “nets” around data, similar to how humans pose questions. Like the neural pathways in our brain, GenAI uses unstructured data to match patterns.  

          So, unstructured data provides a new frontier of data exploration, one that complements the creative “nets” that our brains cast naturally over data. But, alone, unstructured data is fuel for our creativity, and it, too, can benefit from some right-brain capabilities. From a data point of view, the right brain is informed by structured data.  

          Structured data: An analytical, logical, fact-based copilot 

          Structured data is digested, curated, and correct. The single source of the truth. Structured data is our human attempt to place the world in order and forms the foundation of analytical, logical, fact-based decision-making. 

          Above all, it must be high-fidelity, clean, secure, and aligned carefully to corporate data structures. Born from the desire to track revenue, costs, and assets, structured data exists to provide an accurate view of physical objects (products, buildings, geography), transactions (purchases, customer interactions, conversations), and companies (employees, reporting hierarchy, distribution networks) and concepts (codes, regulations, and processes). For analytics, structured data is truth serum.  

          But digested data loses its original fidelity, structure, and serendipity. Yes, structured data shows us that we sold 1,000 units of Widget X last week, but it can’t tell us why customers made those purchasing decisions. It’s not intended to speculate or predict what might happen next. Interpretation is entirely left to the human operator.  

          By combining access to unstructured and structured data in one place, we gain a new way to combine both the left and right sides brain as we explore data. 

          This demo explains how our vector database, KDB.AI, works with structured and unstructured data to find similar data across time and meaning, and extend the knowledge of Large Language Models.

          Where unstructured exploration meets structured certainty, by example 

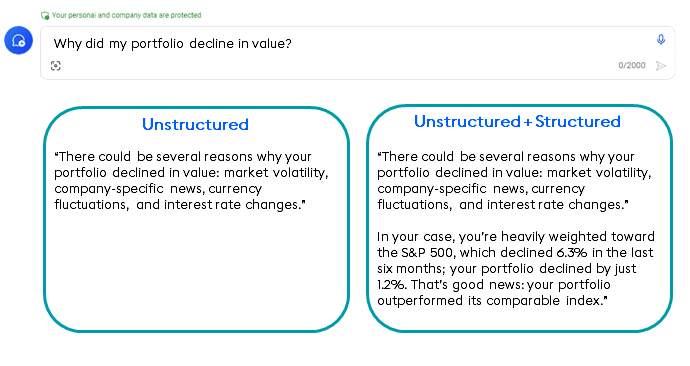
          Combining structured and unstructured data marries accuracy with serendipitous discovery for daily judgments. For example, every investor wants to understand why they made or lost money. Generative AI can help answer that data in a generic way (below, left). When we ask unstructured data why our portfolio declined in value, AI uses unstructured data to provide a remarkably good human-based response: general market volatility, company-specific news, and currency fluctuations provide an expansive view of what might have made your portfolio decline in value.  

          But the problem with unstructured-data-only answers is that they’re generic. Trained on a massive corpus of public data, they supply the most least-common-denominator, generic answers. What we really want to know is why our portfolio declined in value, not an expansive exploration of all the options. 

          Fusing unstructured data from GenAI with structured data about our portfolios provides the ultimate answer.  GenAI, with prompt engineering, interjects the specifics of how your portfolio performed, why your performance varied, and how your choice compared to its comparable index.  

          The combination of expansive and specific insight is shown in the right column, below: 

          Bringing left-and-right brain thinking together in one technology backplane is a new, ideal analytical computing model. Creative, yet logical, questions can be asked and answered. 

          But all of this is harder than it may sound for five reasons. 

          How to build a bridge between unstructured and structured data 

          Unstructured and structured data live on different technology islands: unstructured data on Document Island and structured data on Table Island. Until now, different algorithms, databases, and programming interfaces have been used to process each. Hybrid search builds a bridge between Document and Table Island to make left-and-right brain queries possible. 

          Hybrid search requires five technical elements: 

          1. Hybrid data indexing  
          1. Hybrid query processing 
          1. High-frequency streaming data 
          1. Hybrid time series organization 
          1. Vector embedding-free storage optimization 

          In our next post, we’ll explore these elements and how they build a bridge between creative and logical data-driven insights. Together, they form a new way of constructing an enterprise data backplane with an AI Factory approach to combine both data types in one hybrid context.  

          The business possibilities of combining left-and-right brain analytics are as fundamental as the shift in how decision-making works in the context of AI. So, introduce new thinking methods based on new hybrid data technology capabilities for elevated data exploration and decision-making. 

          Learn how to integrate unstructured and structured data to build scalable Generative AI applications with contextual search at our KDB.AI Learning Hub.

          投稿が見つかりませんでした。

          KX for Databricks

          Seven Innovative Trading Apps and Seven Best Practices You Can Steal

          Quant Trading Data Management by the Numbers

          11 Insights to Help Quants Break Through Data and Analytics Barriers

          デモを予約する

          The Montauk Diaries – Two Stars Collide

          by Steve Wilcockson


          Two Stars Collide: Thursday at KX CON [23]


          My favorite line that drew audible gasps at the opening day at the packed KX CON [23]

          “I don’t work in q, but beautiful beautiful Python” said Erin Stanton of Virtu Financial simply and eloquently. As the q devotees in the audience chuckled, she qualified her statement further “I’m a data scientist. I love Python.”

          The q devotees had their moments later however when Pierre Kovalev of the KX Core Team Developer didn’t show Powerpoint, but 14 rounds of q, interactively swapping characters in his code on the fly to demonstrate key language concepts. The audience lapped up the q show, it was brilliant.

          Before I return to how Python and kdb/q stars collide, I’ll note the many announcements during the day, which are covered elsewhere and to which I may return in a later blog. They include:

          Also, Kevin Webster of Columbia University and Imperial College highlighted the critical role of kdb in price impact work. He referenced many of my favorite price impact academics, many hailing from the great Capital Fund Management (CFM).

          Yet the compelling theme throughout Thursday at KX CON [23] was the remarkable blend of the dedicated, hyper-efficient kdb/q and data science creativity offered up by Python.

          Erin’s Story

          For me, Erin Stanton’s story was absolutely compelling. Her team at broker Virtu Financial had converted a few years back what seemed to be largely static, formulaic SQL applications into meaningful research applications. The new generation of apps was built with Python, kdb behind the scenes serving up clean, consistent data efficiently and quickly.

          “For me as a data scientist, a Python app was like Xmas morning. But the secret sauce was kdb underneath. I want clean data for my Python, and I did not have that problem any more. One example, I had a SQL report that took 8 hours. It takes 5 minutes in Python and kdb.”

          The Virtu story shows Python/kdb interoperability. Python allows them to express analytics, most notably machine learning models (random forests had more mentions in 30 minutes than I’ve heard in a year working at KX, which was an utter delight! I’ve missed them). Her team could apply their models to data sets amounting to 75k orders a day, in one case 6 million orders over a 4 months data period, an unusual time horizon but one which covered differing market volatilities for training and key feature extraction. They could specify different, shorter time horizons, apply different decision metrics. ”I never have problems pulling the data.” The result: feature engineering for machine learning models that drives better prediction and greater client value. With this, Virtu Financial have been able to “provide machine learning as a service to the buyside… We give them a feature engineering model set relevant to their situation!,” driven by Python, data served up by kdb.

          The Highest Frequency Hedge Fund Story

          I won’t name the second speaker, but let’s just say they’re leaders on the high-tech algorithmic buy-side. They want Python to exhibit q-level performance. That way, their technical teams can use Python-grade utilities that can deliver real-time event processing and a wealth of analytics. For them, 80 to 100 nodes could process a breathtaking trillion+ events per day, serviced by a sizeable set of Python-led computational engines.

          Overcoming the perceived hurdle of expressive yet challenging q at the hedge fund, PyKX bridges Python to the power of kdb/q. Their traders, quant researchers and software engineers could embed kdb+ capabilities to deliver very acceptable performance for the majority of their (interconnected, graph-node implemented) Python-led use cases. With no need for C++ plug-ins, Python controls the program flow. Behind-the-scenes, the process of conversion between NumPy, pandas, arrow and kdb objects is abstracted away.

          This is a really powerful use case from a leader in its field, showing how kdb can be embedded directly into Python applications for real-time, ultra-fast analytics and processing.

          Alex’s Story

          Alex Donohoe of TD Securities took another angle for his exploration of Python & kdb. For one thing, he worked with over-the-counter products (FX and fixed income primarily) which meant “very dirty data compared to equities.” However, the primary impact was to explore how Python and kdb could drive successful collaboration across his teams, from data scientists and engineers to domain experts, sales teams and IT teams.

          Alex’s personal story was fascinating. As a physics graduate, he’d reluctantly picked up kdb in a former life, “can’t I just take this data and stick it somewhere else, e.g., MATLAB?”

          He stuck with kdb.

          “I grew to love it, the cleanliness of the [q] language,” “very elegant for joins” On joining TD, he was forced to go without and worked with Pandas, but he built his ecosystem in such a way that he could integrate with kdb at a later date, which he and his team indeed did. His journey therefore had gone from “not really liking kdb very much at all to really enjoying it, to missing it”, appreciating its ability to handle difficult maths efficiently, for example “you  do need a lot of compute to look at flow toxicity.” He learnt that Python could offer interesting signals out of the box including non high-frequency signals, was great for plumbing, yet kdb remained unsurpassed for its number crunching.

          Having finally introduced kdb to TD, he’s careful to promote it well and wisely. “I want more kdb so I choose to reduce the barriers to entry.” His teams mostly start with Python, but they move into kdb as the problems hit the kdb sweet spot.

          On his kdb and Python journey, he noted some interesting, perhaps surprising, findings. “Python data explorers are not good. I can’t see timestamps. I have to copy & paste to Excel, painfully. Frictions add up quickly.”  He felt “kdb data inspection was much better.” From a Java perspective too, he looks forward to mimicking the developmental capabilities of Java when able to use kdb in VS Code.”

          Overall, he loved that data engineers, quants and electronic traders could leverage Python, but draw on his kdb developers to further support them. Downstream risk, compliance and sales teams could also more easily derive meaningful insights more quickly, particularly important as they became more data aware wanting to serve themselves.

          Thursday at KX CON [23]

          The first day of KX CON [23] was brilliant. a great swathe of great announcements, and superb presentations. For me, the highlight was the different stories of how when Python and kdb stars align, magic happens, while the q devotees saw some brilliant q code.