
Key Takeaways
- KDB-X GPU Acceleration targets compute-heavy execution analytics in q.
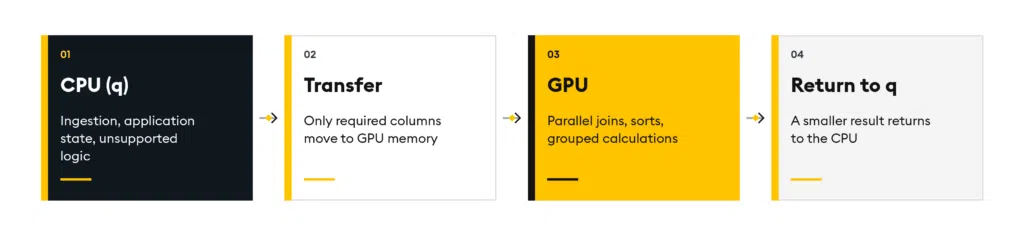
- Suitable workloads run on NVIDIA GPUs. Ingestion, application state, and unsupported logic stay on the CPU.
- RBC Capital Markets measured 7.1x to 11.1x speedups across three execution workloads.
- The tests compared an NVIDIA H100 GPU with a 48-core CPU. Timings covered compute only and excluded I/O.
- Teams exploring GPU acceleration should begin with one named q workload and benchmark it using representative data, a CPU baseline, clear timing boundaries, and defined success criteria.
An execution analytics result has a shelf life. A curve calibration completed after the research cycle, a child-order analysis finished after trade date, or a cost signal returned after the session can still explain what happened. It cannot help the team change what happens next.
RBC Capital Markets tested KDB-X GPU Acceleration across three compute-heavy execution workloads: VWAP curve-tilt backtesting, child-order spread capture, and intraday VWAP cost evolution. The question was not simply how much faster each calculation could run. It was whether faster analytics could create more time to recalibrate models, review a fuller order population, and investigate execution while the session was still active.
RBC Capital Markets also doubled its capacity for client portfolio deep dives, giving teams more room to bring deeper execution evidence into client conversations.
KDB-X GPU Acceleration targets suitable performance-critical q paths while ingestion, application state, unsupported logic, and low-volume work remain on the CPU. Teams can keep the application and schema in place, adapt only the candidate path, and avoid building a separate CUDA implementation.
What Results Did RBC Capital Markets Achieve with KDB-X GPU Acceleration?
Faster functions matter when they change the operating window around them. For RBC, that meant testing whether a broader calibration sweep could finish inside the research cycle, a full demonstrated child-order population could be checked on trade date, and intraday cost evolution could return while the session was still active.
| Execution workload | Published data volume | CPU | GPU | Change |
|---|---|---|---|---|
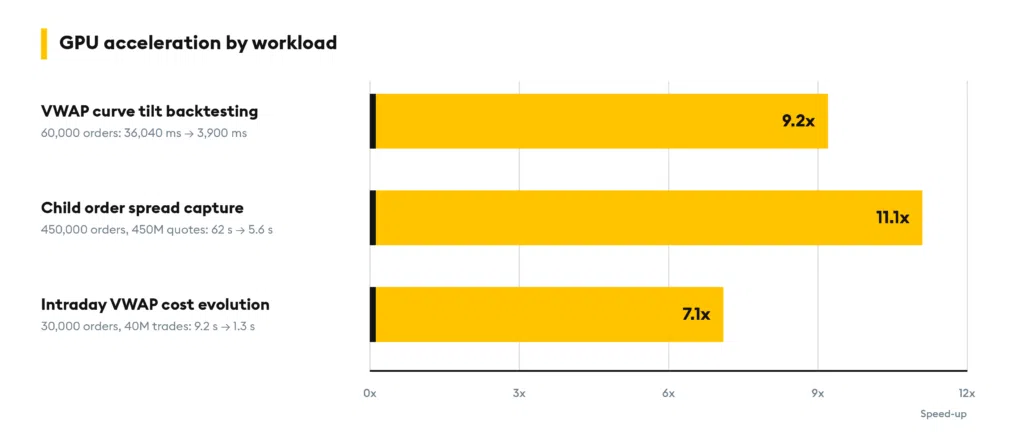
| VWAP curve-tilt backtesting | 60,000 orders | 36,040 ms | 3,900 ms | 9.2x |
| Child-order spread capture | 450,000 orders and 450 million quotes | 62 s | 5.6 s | 11.1x |
| Intraday VWAP cost evolution | 30,000 orders and 40 million trades | 9.2 s | 1.3 s | 7.1x |
Measurement context: RBC Capital Markets tested the three compute stages on an NVIDIA H100 GPU against a 48-core CPU baseline, with I/O excluded. Results apply to the tested functions, data volumes, hardware, and measurement boundary and do not predict performance for a different workload.
Which Execution Analytics Workloads Were Tested With GPU Acceleration?
RBC’s published tests connect runtime to model cadence, analytical coverage, and decision timing. Each result is specific to the measured path, but together they show how faster compute can change the day-to-day workflow. Every customer workload still requires its own benchmark.
VWAP Curve-Tilt Backtesting
VWAP algorithms depend on intraday volume profiles. When trading patterns change, teams need to test whether the current curve still describes the way volume is forming. A broad curve-tilt sweep can involve repeated joins and grouped or sliding-window calculations across order history. If it overruns the research cycle, the team reduces the sweep or waits longer to update the model.
At RBC, 60,000 orders were processed in 3,900 ms on the GPU compared with 36,040 ms on the 48-core CPU baseline, a measured change of 9.2x. In the demonstrated workload, that shorter runtime supported a weekly or daily recalibration cadence, creating more opportunities to revisit the model as market behavior changed.
Child-Order Spread Capture Analysis
A child-order review often aligns orders with a large quote history, then calculates metrics across the joined population. The row count can make that analysis expensive enough that the team samples data or waits for a later batch. That reduces the evidence available for investigating venue outcomes, passive fills, and spread capture.
At RBC, the test aligned 450,000 orders with 450 million quotes. Runtime fell from 62 s on the CPU to 5.6 s on the GPU, an 11.1x change for the measured compute stage. The full demonstrated population could be checked on trade date, giving the team a richer body of evidence while the execution context was still current.
This result applies to the tested data shape and boundary and does not imply that every child-order workflow can analyze every quote in real time.
Intraday VWAP Cost Evolution
Cost evolution analysis repeatedly aligns orders and trades as the session develops. Its value depends on when the result returns. A next-day answer can support review and reporting, but it cannot give the desk more time to investigate an active order or a changing execution trajectory.
At RBC, 30,000 orders and 40 million trades were processed in 1.3 s on the GPU compared with 9.2 s on the CPU, a 7.1x measured change. The demonstrated path returned during the session, creating time to investigate an active order or changing execution trajectory instead of explaining it the following day.
Value for another team will depend on refresh cadence, concurrency, surrounding I/O, and the downstream workflow.
Use GPU Acceleration Selectively
The point is not to move the whole application to the GPU. CPU and GPU memory are separate, so a strong candidate performs substantial parallel work, moves only the required columns, reuses resident data where possible, and returns a smaller result to q. Moving a wide table for one short operation can erase the compute advantage.
The KDB-X .gpu namespace exposes supported data movement, queries, joins, sorting, append, and device functions. This keeps the accelerated path inside q, but it is not automatic offload. Candidate functions may require targeted adaptation, while unsupported or transfer-heavy paths remain on the CPU.
Other Execution Workloads to Evaluate
RBC’s results show what is possible for three execution workloads. The same selective approach may apply elsewhere, but public proof and GPU fit vary, so treat these paths as candidates until the customer implementation is measured.
- Streaming TCA and markouts with resident intraday data and compact results
- Full-history backtesting and repeated parameter sweeps
- End-of-day sorting before corrections, reruns, or downstream reporting
- Algo and venue analysis across orders, fills, quotes, and benchmarks
Which Execution Analytics Workloads Are Good Candidates for GPU Acceleration?
Start with One Named Workload
Start with the q functions that dominate runtime, representative data volume, the CPU baseline, the processing deadline, and the decision the result supports. Then identify candidate GPU paths, likely exclusions, data-movement requirements, and a fair measurement boundary.
- Identify the q functions that dominate runtime.
- Choose a representative data volume.
- Record the current CPU baseline.
- Define the processing deadline or working window.
- Document the decision the result is intended to support.
- Identify candidate GPU paths, exclusions, and data-transfer requirements.
Use the same input, output, and success criteria on CPU and GPU. Record whether timing covers the compute stage or the full workflow, including I/O and result materialization.
Benchmark Your q Workload With KX
Bring one named q workload, its current runtime, representative data volume, and the window the team wants to improve. A KX engineer will review the candidate functions, data movement, hardware context, likely exclusions, benchmark order, and success criteria.
Is your CPU cluster starting to write IOUs against time-sensitive workloads? Learn more about KDB-X GPU Acceleration, or benchmark one of your existing workloads to see where it could help your firm buy back time.