From obligation to opportunity: Redefining best execution 

“…ascertain the best market for the subject security, and buy or sell in such a market so that the resultant price to the customer is as favorable as possible…” – FINRA Rule 5310  

The days of shouting across a packed trading floor are long gone, but while modern financial dealing may be quieter, executing effectively is now vastly more complex and challenging. Amid the gentle hum of servers, your traders face a high-pressure environment where milliseconds can mean millions of dollars.  

In today’s fragmented and highly competitive markets, achieving best execution demands more than a laser focus on price; you must weigh varied factors from order size to venue selection.  

Capital market firms are stepping up to this challenge—not just because best execution is vital to proprietary alpha generation but also because it’s critical to delivering good customer outcomes. Yet, while gaining a competitive advantage and attracting more loyal clients are strong calls to action, you must also beware of tightening regulations that make best execution essential, not optional.  

Like Odysseus sailing between the monster Scylla and the whirlpool Charybdis, your firm needs to chart the right course for profitability and customer value while avoiding regulatory wrath or the danger of being sucked down by the complexity and costs of compliance.  

Whether your focus is equities, derivatives, bonds, forex, or any other type of instrument, read on as we explore what it takes to successfully navigate the challenges of best execution amidst the complexities and pace of today’s capital markets.   

Best execution goes beyond price  

Markets and trading strategies continuously evolve, as do the standards for best execution. As manual trading gave way to electronic systems in the 1980s, real-time algorithmic approaches in the 2000s, and the modern era of AI and machine learning, any tolerance for errors or delays vanished.  

Today’s constant connectivity, combined with automated execution at the speed of thought, means that precision and efficiency are now not exceptional, but expected.   

Firms have a vast range of trading venues at their fingertips and a torrent of streaming information, commonly 100,000 ticks per second or more, to leverage for optimal outcomes. Harnessing this data has enabled firms to broaden their view of best execution far beyond price—assessing complex factors like transaction costs and market liquidity in real-time to achieve the best possible results.  

Meanwhile, tightening regulatory scrutiny is also raising the bar for execution. Whether it’s MiFID II in the EU or the Dodd-Frank Act and Regulation NMS in the US, financial firms are obliged to act in customers’ best interest when executing orders. Updated rules again define best execution as more than just securing an optimal price—demanding that firms consider a range of factors like transaction cost, speed, and the likelihood of settlement. To demonstrate compliance, firms are also expected to monitor and analyze trading outcomes compared to the market and report on the results.  

Best execution: A high-stakes pursuit  

For capital market firms engaged in proprietary high-frequency trading, best execution is primarily about accelerating alpha generation, minimizing costs and mitigating risk.  

For example, let’s say you’re executing a pairs trading strategy for gold and silver. Suddenly, an exploitable price gap emerges, but you execute at a sub-optimal venue or 100 milliseconds too late—leading to increased slippage, higher fees, and reduced or negated profits.   

High-quality execution is similarly important on the risk management side of the equation to minimize losses from sudden and unexpected market movements, like the infamous GameStop short squeeze.  

For financial firms that deal with client orders, demonstrating best execution is also vital to attracting and retaining customers. Failure means losing trust, a damaged reputation, and the potential for significant regulatory penalties.   

We’ve seen high-profile examples over the past few years, including the SEC fining online brokerage Robinhood $65 million in 2020 for offering customers inferior execution prices. Even more recently, in 2022, FINRA fined Deutsche Bank Securities $2 million for failing to meet best execution obligations after routing orders in a way that created inherent delays and potentially lower fill rates.  

Powering best execution  

With milliseconds now making the difference between success and failure in the markets, firms need to leverage a wide range of data, technology, and processes to act quickly and confidently, drive better customer outcomes, and ensure regulatory compliance.  

Optimizing execution is a multifaceted challenge that must balance trade characteristics, like order size and asset type, with wider market conditions. For instance, firms need to consider factors like:  

  • Volatility: In turbulent markets with rapid price movements, like cryptocurrencies, firms must be able to monitor and react to changes in real time to achieve best execution  
  • Liquidity: In more illiquid markets, like fixed-income investments, or when executing large orders, firms must minimize price slippage  
  • Venue selection: In today’s fragmented markets, the choice of where to execute a trade is crucial, as each venue involves different fees, execution speeds, and liquidity levels  

Best execution has evolved from a regulatory obligation to a competitive opportunity. Firms are increasingly leveraging the power of data to deliver and demonstrate optimal outcomes while improving operational efficiency. Key solutions include:  

  • Real-time data analytics: The ability to ingest, process, and analyze high-frequency data streams gives traders an accurate and up-to-date view of market conditions—letting them keep pace with price, volume, and liquidity indicators across multiple venues and execute with optimal timing. Constant surveillance for sudden market movements or anomalies and the ability to optimize orders on-the-fly can also reduce risk in proprietary trading  
  • Smart order routing: Based on factors like price, liquidity, and fees, smart order routing can automatically direct trades to the best choice of venue at any given time. It’s also possible to spread orders across multiple venues to minimize the impact on market prices and further optimize execution  
  • Algorithmic trading: Along with enabling sub-second execution speeds and precise timing, algorithmic trading can also break down large orders into smaller batches to minimize market impact. Additionally, algorithmic trading models enable more advanced strategies that can adapt in real time to changing market conditions  

Crucially, these data-driven strategies also support the human side of the best execution equation, giving teams the granular insights needed to monitor performance, review issues, and test controls as per established policies and procedures.  

The analytics advantage  

When it comes to best execution, your engine room is data analytics. Advanced analytics power the informed choices and agile technologies you need to optimize alpha generation and maximize customer value, especially when leveraging high-frequency trading strategies. Two areas are especially relevant to best execution:  

  • Pre-trade analytics: Analyzing petabyte-scale datasets with microsecond latency, pre-trade analytics focus on optimizing future order performance by determining the best execution and risk management strategy. This might include complex simulations to assess the market impact of trades, improved transaction cost analysis to minimize fees or slippage, and leveraging real-time data feeds to optimize smart routing decisions. By fully documenting trading decisions, pre-trade analytics also strengthens compliance and operational efficiency  
  • Post-trade analytics: Best execution is a continuous challenge that demands constant effort. By calculating metrics like effective spread and implementation shortfall, post-trade analytics can benchmark performance against various indices and highlight areas for improvement. Evaluating past trades at a granular level produces vital insights that can help fine-tune strategies for optimal customer value, as well as improve internal risk management  

Together, pre- and post-trade analytics offer a powerful solution for achieving best execution—enabling firms to optimize and refine trading strategies and enhance operational efficiency despite increasing compliance demands.  

Stacking up for best execution success  

By integrating real-time feeds from exchanges, financial institutions, and other data providers, trading desks can execute faster than competitors and deliver better outcomes. However, extracting actionable insights from petabyte-level data fast enough to power moment-to-moment algorithmic or high-frequency trading is no easy task.  

A high-performance analytics stack is crucial to capitalize on streaming data by making it fast and easy to load, transform, query, or visualize enormous datasets to find patterns or anomalies. With the ability to ingest large volumes of information, process it in milliseconds, and offer very low-latency response times, a highly performant solution enables your traders to react rapidly to market movements or predict likely outcomes, continuously adjusting orders to ensure best execution.  

Such high-speed analytics can also help maintain the real-time records demanded by industry regulations and provide an auditable trail that proves best execution, minimizing the cost of compliance and maintaining operational efficiency. Additionally, streaming analytics can drive continuous trade surveillance, detecting major violations like front-running or churning in real time for even greater peace of mind.  

How can KX support with best execution

KX helps you meet best execution requirements while turning regulatory obligations into opportunities. Our high-performance database, kdb+, enables real-time analytics and smarter trading decisions. With kdb Insights Enterprise, gain fast query speeds, intuitive tools, and robust reporting for data-driven compliance. 

Learn more by watching our webinar with ICE and ExeQution Analytics and learn ‘Six best practices for optimizing trade execution.’  

We are here to support you as market complexity and best execution requirements grow, arming you with the advanced technology you need to stay in compliance and ahead of competitors.  Learn more about how our solutions enhance pre- and post-trade analytics, or book a demo to see our capabilities in action. 

Supercharging your quants with real-time analytics

Webinar: Six best practices for optimizing trade execution

In our latest webinar, Leon Liang from ICE, Feargal Murphy from KX, and Cat Turley from ExeQution Analytics explore best practices for optimizing trade execution, sharing critical strategies and real-world solutions that leading firms are using to turn transaction cost analysis (TCA) into a powerful driver of trade performance and risk management. 

Success in the financial markets depends on speed, precision, and the ability to draw actionable insights from vast datasets in real time.  

Trade execution – the process of buying and selling securities on behalf of clients or for proprietary trading – is increasingly under scrutiny as firms seek to optimize every aspect of performance. For many, this process goes beyond simply managing costs; it’s about capturing alpha, ensuring compliance, and enhancing decision-making with unparalleled precision. Yet, achieving this level of sophistication requires you to redefine your approach.

Historically, TCA has focused on regulatory compliance, serving as a box-ticking exercise rather than a tool for actionable insights. But as our experts from ICE, KX, and ExeQution Analytics highlight in this session, TCA can – and should – be a robust framework for continuous improvement and real-time decision-making.  

Watch the full session here or browse the key takeaways below: 

1. Redefining trade cost analysis with real insights 

Cat Turley highlights that while TCA has traditionally been a compliance exercise, reframing it as ‘trade research’ can yield actionable insights. “The term ‘research’ implies learning and continuous improvement, transforming TCA from a box-ticking exercise to a tool for real performance enhancement,” she explains. This shift is essential for firms looking to optimize trading decisions beyond mere regulatory requirements. 

2. Leveraging real-time data for competitive edge in trade execution

Fergal Murphy underscores the critical role of real-time data in capital markets, describing KX’s platform as the leader in time-series analytics, essential for front-office applications. “Our platform’s low latency and ability to handle high-frequency data at scale make it indispensable for pre- and post-trade analytics, backtesting, and quantitative research,” Murphy states. The discussion highlights how KX enables firms to make in-the-moment decisions, critical in fast-paced trading environments. 

3. Data integration and flexibility are key to effective analytics 

Integrating diverse datasets quickly is often a bottleneck in TCA. Leon Liang notes that ICE’s vast data sets, combined with KX’s powerful data ingestion capabilities, enable the rapid building of a comprehensive trade model. By pairing ICE’s quantitative datasets with KX’s platform, users can rapidly test scenarios and refine strategies, reducing trade execution lead times. 

4. Reducing the complexity of TCA for scalable implementation 

Many firms struggle to balance the complexity of TCA processes with the need for speed and accuracy. Turley explains that ExeQution Analytics specializes in simplifying data workflows, helping firms integrate market and trading data seamlessly. This approach empowers firms to “access the value of TCA in near real-time,” avoiding analysis delays that can impact strategic outcomes. 

5. Building a data-driven culture for long-term success 

Leon Liang and Fergal Murphy emphasize the importance of embedding data and analytics into the organizational culture. Murphy points out that KX’s solutions enable firms to streamline data operations, providing “actionable insights to inform strategic decisions and reduce risks” at a scalable level. For firms aiming to become ‘AI-first’, these tools foster an environment where data-led decision-making becomes the norm. 

6. A roadmap to advanced trading analytics with KX and ICE 

The webinar concludes with a roadmap for leveraging KX and ICE solutions in trade execution optimization. By adopting an integrated approach with real-time analytics and a flexible data environment, firms can build a more responsive and efficient trading ecosystem. According to Murphy, “Our combined capabilities allow traders to gain insights at every stage of the trade lifecycle, from pre-trade research to post-trade performance analysis”. 

Learn how KX can help enhance trade execution quality, manage risk and improve decision-making with pre-trade analytics and post-trade analytics. Discover how KX and ICE are empowering traders and portfolio managers to improve decision-making, operational efficiency and trading practices with our Fixed Income Accelerators.

投稿が見つかりませんでした。

Transforming data science with PyKX a comprehensive guide to onboarding

Tips, tricks, and solutions from the kdb+ community

The kdb+ community is filled with developers sharing knowledge and solving real-world problems. Whether working with iteratorsqQSL, or IPC, there’s always something to learn from others who have tackled similar challenges. In this post, I’ve curated some great tips, tricks, and solutions from discussions in the community and grouped them into common themes.

Let’s explore.

1: Iterators

Iterators replace loops, which are commonly seen in other programming languages. In kdb+, iteration is a fundamental operation that allows for elegant and efficient data manipulation. Unlike traditional loops, iterators improve code readability and performance by leveraging kdb+’s vectorized operations. This section explores common questions about their usage and syntax.

Problem: A user wants to pass two variables of the same length using the each operator. A common task when you need to apply a function element-wise over two lists. (view discussion)

Solution: The solution involves using the each-both operator (‘), which allows you to pass elements from two lists pairwise.

Example:


// Two lists of same length to be passed element-wise to a function
list1: (1 2 3;4 5 6;7 8 9 10 )
list2: 0 1 2

// Using ' (each both) to apply function to return index in list2 for each list1 element
{x[y]}'[list1;list2] 	// Output 1 5 9


The expression {x[y]} defines an anonymous function where x is the first argument and y is the second argument. When you use the each-both operator (‘), it retrieves the corresponding element from list1 using the index specified by list2.

There are multiple each variants to accommodate different types of input and output requirements. Here’s a quick guide to the most commonly used forms:

  • each – (each): Applies to each item
  • each-both – (‘): Applies pairwise to elements from two lists
  • parallel each – (peach): Executes each in parallel, useful for distributing workload across multiple processors
  • each-left – (\:): Applies each item in the first argument, with the second argument held constant
  • each-right – (/:): Applies each item in the second argument, with the first argument held constant
  • each-prior – (‘: or prior): Executes where each element is paired with the preceding element in the list, often used in time series or cumulative calculations

Different variants are useful for different scenarios, allowing you to leverage kdb+’s functional programming flexibility.

Problem: Sometimes, iterative operations are performed where only the final result matters, but intermediate steps needed can add unnecessary overhead. (view discussion)

Solution: Use the over operator with a function to focus on optimizing for the final result to reduce computational overhead.

Example: Iterators in kdb+ like over (denoted as /) and scan (denoted as \) are accumulators used for repeated execution of a function over data. While over only returns the final result, scan returns intermediate results at every step of the iteration.


// Define a function that adds numbers iteratively
f:{x+y}

// Apply function iteratively over a list, but focus on the final
0 f/ 1 2 3 4 5 // Output: 15

// Apply the function over a list using 'scan'
0 f\ 1 2 3 4 5 // Output: 1 3 6 10 15

This approach ensures minimal overhead by only retaining the final result, which is useful for scenarios where intermediate values are unnecessary.

More discussions:

For more information on iterators, check out our documentation. The KX Academy also has several modules ranging from foundation concepts in iterators L1 to advanced concepts in iterators L2 and iterators L3.

2: Advanced select operations

Functions in kdb+ enable powerful data manipulation capabilities, from handling dynamic queries to applying conditional logic across entire vectors. While static selects are straightforward, building them dynamically based on input variables introduces added complexity. Using parse and functional selects allows for flexible querying that adapts to changing conditions. Additionally, vectorized conditional logic enables efficient if-else operations across large datasets without loops, leveraging kdb+’s performance strengths. This section covers discussions on parsing dynamic functional selects and applying nested conditions across vectors—key techniques for processing and analyzing data at scale.

Problem: A user needs to construct a dynamic functional select based on input parameters. (view discussion)

Solution: This solution demonstrates how to construct a functional select dynamically using parse, making it adaptable to changing inputs. This allows for flexible querying without having to hard-code the logic.

Example:


//define table
table:([] sym:`a`b`c; price:10 20 30)
sym price
---------
a   10
b   20
c   30

// parse to get functional form of query
parse"select from table where price > 15"
?
`table
,,(>;`price;15)
0b
()

// pass variable to this functional form
{?[table;enlist(>;`price;x);0b;()]}[15]
sym price
---------
b   20
c   30


In this example, {?[table; enlist(>; price; x); 0b; ()]} creates a flexible query that filters based on a specified price threshold. You can see how this was informed by the output from parse. This dynamic approach allows users to adapt their logic dynamically, supporting scenarios where conditions may shift depending on user input or other real-time data.

Problem: A user wanted to apply multiple nested conditions on vectors, essentially performing an if-else logic but at scale across large datasets. (view discussion)

Solution: The community provided a concise solution using the vector conditional (?) operator, demonstrating how to efficiently apply nested conditions across vectors without resorting to traditional loops, preserving kdb+’s performance benefits.

Example:


// define table
t:flip `sym`price!(`abc`def`ghi;10 100 1000)
sym price
---------
abc 10
def 100
ghi 1000

// tag with high or low depending on price
update c:?[price>10;`high;`low] from t
sym price c
--------------
abc 10    low
def 100   high
ghi 1000  high


Here, the expression ?[price > 10; high; low] applies a simple conditional check to label rows as either “high” or “low” based on the price. This method, particularly effective for tagging or flagging financial data, keeps the code clean and easy to adjust as business logic changes.

Both approaches—dynamic functional selects and vectorized conditional logic—highlight kdb+’s strengths in handling large-scale data processing without compromising on speed or flexibility.

More discussions:

For further learning, explore our Functional qSQL documentation and curriculum, as well as our Vector conditional documentation and curriculum.

3: Tickerplant architecture and symbol management

Managing tick data efficiently is crucial in high-frequency trading (HFT) systems, where vast amounts of data must be processed and queried with minimal latency. The kdb+ community has deep insights into partitioning, symbol files, and RDB (real-time database) optimizations. Below are insights from community discussions addressing common challenges in handling tick data.

Problem: A user asked about best practices for partitioning on symbols, questioning whether it’s better to store the data in one table or split it across multiple tables.

Solution: A highly informative post explained that partitioning on symbols depends on the number of distinct symbols in your dataset and the frequency in which they are accessed. The solution outlined different scenarios (high-frequency vs low-frequency symbols) and how to adjust the partitioning schema accordingly.

Key takeaways:

  • Symbol sorting for performance: A single table setup can be efficient when handling many symbols, but sorting data by symbol within a date-partitioned database is crucial. Applying a parted attribute to the symbol column enables faster access to specific symbols, significantly enhancing query performance for symbol-based queries
  • Data flow design: Transitioning from the in-memory table to a disk-based table raises challenges, particularly for intraday queries. If the data is too large to keep in memory, an intraday writer with a merge process might be necessary
  • Parallelizing data consumption: You can parallelize data consumption for large-scale real-time systems by distributing topics across multiple consumers or partitions. Kafka, for example, allows this with multiple partitions for a single topic, which simplifies data distribution and offers resilience (e.g., if one consumer fails, another can take over)

More discussions:

For more information on tickerplant architectures and symbol management, check out our documentation or our KX Academy course.

4: Script execution

In multi-process kdb+ environments, where multiple scripts or feeds need to run simultaneously and communicate, efficient process management is key to maintaining performance and stability. Processes need to be started, monitored, and synchronized without excessive overhead or manual intervention.

Problem: How to start processes concurrently and ensure they can communicate, manage execution and verify that all necessary handles are open and ready. (view discussion)

Solution: A community member shared multiple approaches for addressing this, focusing on timed checks and modular script loading.

  1. Using a timer with .z.ts: This approach leverages the .z.ts timer function to periodically check if specific handles are open. Once the required handles are ready, the rest of the script or main function can run. This method ensures that dependent processes are only executed once prerequisites are confirmed.
  2. Modular script loading: Another approach is to split the code into modular files and load them conditionally. By moving the main execution code into a separate file (e.g., main.q), the script can dynamically load this code only after confirming that handles are open. This modular approach keeps the initial script lightweight and avoids executing dependencies prematurely.

Example:


// Start multiple processes from a script
h:(); .z.po:{h,:x};
{system "q ",x," -p 0W &"} each ("feed1.q";"feed2.q")

// if handles are open – run main with rest of code
.z.ts:{if[2=count h;system"t 0";main[]]}
\t 1000
main:{[] show "Rest of code" }

// if handles are open – load main.q with rest of code
z.ts:{if[2=count h;system"t 0";system"l main.q"]}
\t 1000


This example demonstrates the timer function checking for open handles and then either running a main function or loading main.q, based on handle readiness.

For more insights and in-depth techniques on managing multi-process environments in kdb+, check out our dedicated courses on script execution and process management at the KX Academy.

The kdb+ forums are a treasure trove of knowledge, with developers constantly sharing their tips, tricks, and solutions to real-world problems. The posts highlighted in this article represent just a fraction of the collective wisdom available. I encourage you to dive deeper into the forums, contribute your own solutions, and continue learning from the community.

If you found these tips helpful, why not join the discussion on the forums or join our Slack community to chat 1:1 with our community experts.

投稿が見つかりませんでした。

Transforming data science with PyKX a comprehensive guide to onboarding confirmation

Your Whitepaper Awaits

Please use this link at any time to access your free copy of “Transforming data science with PyKX – A comprehensive guide to onboarding”.


Interested in booking a demo?


    For information on how we collect and use your data, please see our privacy notice. By clicking “Download Now” you understand and accept the terms of the License Agreement and the Acceptable Use Policy.

    Temporal IQ

    Understand the heartbeat of Wall Street with temporal similarity search 

    Structured market data is Wall Street’s heartbeat. Most banks have exceptional tick stores capturing micro-movements in prices, trade executions, and related fundamentals and sentiment.

    In recent years, unstructured data has been invited to the party. Firms have started using advanced analytics and AI techniques to identify patterns and trends in news articles, social media, earnings calls, etc., to help enhance their decision-making capabilities. 

    These techniques assess similarity (e.g., approximate nearest neighbor algorithms, vector databases, data encoding) to power applications that process primarily unstructured data: natural language processing, image, audio, and video processing.

    But why stop there? Why not apply the same techniques to our old friend, structured data?   

    Such an innovation could bring the magic of similarity search to time-series data to help quantitative analysts assess market micro-movements and predict what might happen next.  

    It’s called temporal similarity search, bringing AI’s secret sauce to quantitative trading.   

    Here’s an overview of temporal similarity search and why it’s the newest powerful trading tool Wall Street analysts use today.  

    The challenge: Quant trading and volatile moments in time  

    Imagine you’re a trader in the capital markets. You hold a significant position in IBM, and it generally fluctuates within its ‘typical’ range according to historical norms.  Suddenly, IBM’s price surges outside its normal range, and you get an alert. You watch with great interest as the price drops, but not back to its ‘expected’ price. Then it spikes again, then down, forming the ‘shape’ of an M (see below).  

    M-shape trading pattern

    Your portfolio manager calls. “What’s going on?”

    ”What will happen next?”

    Sometimes, volatility is easily explained. Earnings releases, news, or poor performance by a related company are often the underlying cause of market moves.

    But usually, there’s more to be understood.

    Understanding the heartbeat of Wall Street

    Capital markets data skip, swing, and spike like our human heartbeats. Most banks have exceptional tick stores of micro-movements of prices, trade executions, and related fundamentals and sentiment. The trick is finding similarities and dissimilarities among these patterns. Temporal similarity search helps quantitative traders assess the time window patterns like needles in a haystack based on a clever application of the ‘Approximate Nearest Neighbor’ algorithm to temporal data.

    For example, analysts can query a historical ticker plant for time windows in the past year that match the ‘M’ pattern in the example above. It returns a set of time windows that match the pattern, ranked by similarity.

    By instantly finding similar patterns within millions, billions, or trillions of time-series data patterns, analysts can quickly compare the underlying factors that might have caused this pattern of activity. Perhaps more importantly, they can use this information to compare current conditions to those in the past and predict what might happen next.

    Temporal similarity search in action

    Temporal similarity search starts with a query: analysts provide a signature of data movement and a range of search times. For example, “Find me the most similar M shapes in the last month.” The system then searches for similar patterns in its historical ticker plant, ranks, and returns the results.

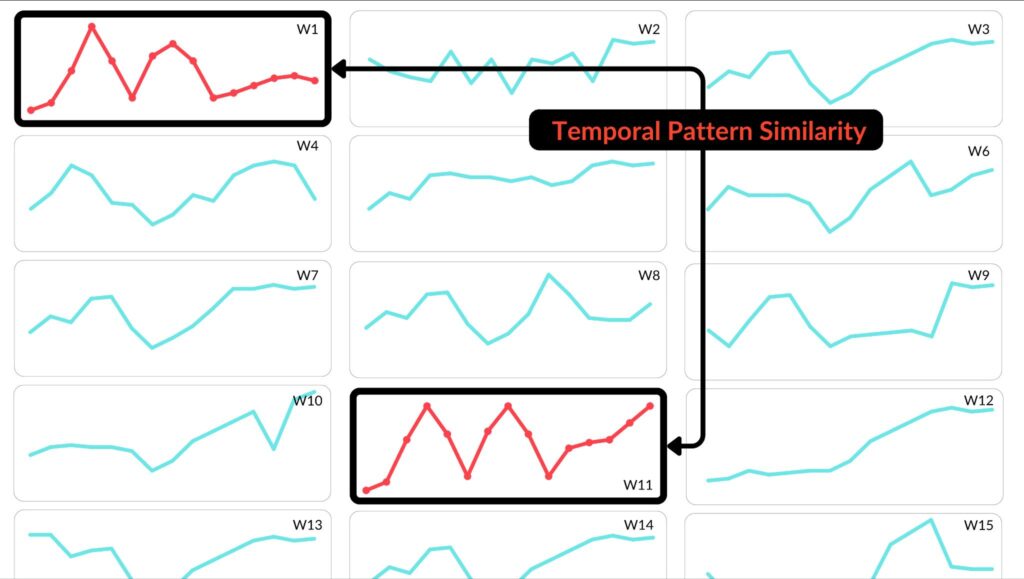
    Below are fifteen time-windows showing a similar pattern:

    Fifteen time windows showing a similar M-shape trading pattern

    Finding these heartbeat patterns is just the first step.  

    Now, we must ask the critical question: what happens next?  

    To answer, we compare two (or more) time slices. For example, in week one, after an M-shaped flutter, the price flattened but stayed above its historical norm, but in week 11, it adjusted to the new high-water mark. Analysts compare, filter, and explore these patterns as they gain insight. 

    Compare week 1 with week 11

    This three-step process of searching, comparing, and exploring these temporal heartbeats and data continues as analysts uncover new questions to ask and conditions to find similarities within.   

    But that’s not all. Not only can temporal similarity search be used for exploratory analytics, but the technology also has a continuous mode of execution that allows in-stream analysis of data for patterns as they happen. This style of deploying continuous similarity search helps power real-time applications like surveillance, execution analytics, and many alerting systems.   

    The resulting system of comparative analytics, accelerated by the similarity search deployed on either historical or streaming data, significantly enhances the speed and efficiency of analysts’ work. By using temporal patterns as a baseline for exploration, analysts can perform their tasks faster and more effectively.   

    1. Analysts provide a ‘signature’ or pattern of data movement to the similarity search engine.
    2. Similarity search finds and ranks similar time-series ‘windows’ and returns the closest fits to this shape.
    3. Analysts use these time windows to analyze, compare and contrast subsequent market movements, predict what might happen next, and act.

    Use cases of temporal similarity search  

    Temporal similarity search is a versatile technique that can power any application that processes time series data. Its two execution modes — continuous and historical — make it adaptable to a variety of market conditions, powering a range of applications on Wall Street.   

    • Quant research. Historical temporal similarity search helps quantitative trading experts compare a given time-series pattern to historical time windows to analyze trading strategies with “as if” conditions to simulate and compare behavior in similar markets
    • Execution analytics. Execution analytics depends on finding the right time to execute a trade based on price, commissions, fees, volumes, and market impact. These factors dynamically fluctuate during the day, so continuously assessing them in the context of similar favorable and unfavorable patterns helps traders quickly spot the best time to act
    • Algorithmic trading. Algorithmic trading strategy is sensitive to market prices, trading position size, execution strategy, portfolio requirements, order flow, risk, and exposure. Continuous temporal similarity search helps assess these parameters for optimal algorithmic trading
    • Trade surveillance. Understanding deceptive, disallowed, or manipulative trading patterns depends on detecting similarity in trading motion. Trade surveillance applications can more easily spot patterns indicating trade layering, spoofing, front-running, or 123-go for compliance, risk, or regulatory surveillance applications 

    These applications all benefit from understanding the similarity and dissimilarity among moments in the market — and their underlying causes.  

    Temporal similarity search: A new way to assess the heartbeat of the capital markets  

    Thanks to the innovative application of AI technologies to structured, streaming, and historical time-series data, quant traders now have a new tool in their analytics toolbox. Temporal similarity search helps quantitative analysts understand the heartbeat of any market data and more confidently predict what might happen next (or, at least, should have happened).  

    For a deeper dive into the technology behind temporal similarity search, read: Turbocharge kdb+ databases with temporal similarity search. Learn how KX can help your firm seamlessly analyze data patterns, compare market activity, and detect anomalies as they occur with  pattern and trend analytics.

    Turbocharge kdb+ databases with temporal similarity search

    kdb+ has long been renowned for its high-performance time-series database capabilities and excels at storing and analyzing vast amounts of structured data with rapid query performance.

    Today, we are excited to share that kdb+ databases can now be integrated into KDB.AI, delivering two advanced capabilities to your kdb+ deployments: advanced pattern matching for structured time-series data and semantic similarity search.

    Similarly, this integration enables developers to mount massive kdb+ datasets into their AI workflows, which, in some cases, can contain trillions of rows.

    
    db.create_table(
        table="trade",
        external_data_references=[{"path":b'/db', "provider" :"kx"}],
        partition_column="date")
    

    Using this connection, users can leverage KDB.AI’s powerful Non-Transformed Temporal Similarity Search (TSS) and semantic vector search directly upon data in kdb+. This means there is no need for costly and impractical data migration between systems.

    By connecting these systems, organizations can unlock deeper insights, identify subtle patterns, and make more informed decisions based on a holistic view of their data estate.

    The primary driver behind this integration is the enhancement of decision-making capabilities. By bridging the gap between traditional time-series data and advanced pattern recognition, organizations can now generate real-time insights that were previously challenging to obtain. This integration enables insights from both structured and unstructured data, leading to more nuanced and accurate predictions, risk assessments, and operational strategies.

    Benefits of temporal similarity search on kdb+

    The connection between KDB.AI and kdb+ is designed to drive rapid adoption and deliver immediate value in any field dealing with large volumes of time-series or unstructured data.

    The integration aims to achieve several objectives:

    1. Facilitate Temporal Similarity Search (TSS) on both splayed and partitioned kdb+ tables, enhancing the ability to identify temporal patterns in massive datasets.
    2. Enable similarity searches on embeddings stored in kdb+ splayed tables, allowing users to perform semantic similarity searches and RAG on their unstructured data.
    3. Provide comprehensive support through reference architectures and examples, ensuring that users across industries can quickly implement and benefit from the integration.

    Another key aspect of this integration is its ease of use for existing kdb+ users. The introduction of a q API makes it intuitive for q programmers to leverage advanced pattern matching and similarity search capabilities using a familiar language.

    
    gw:hopen 8082
    gw(`createTable;
        `database`table`externalDataReferences!
        (`default;`trade;enlist `path`provider!("/db";`kx)))
    

    This familiarity accelerates adoption and enables organizations to capitalize on their existing data infrastructures.

    Temporal Similarity Search (TSS)

    Integrating kdb+ with KDB.AI enables Non-Transformed Temporal Similarity Search on raw time series data without migrating and enables the following key capabilities:

    Pattern matching

    Using Temporal Similarity Search (TSS) integrated with kdb+ and KDB.AI enables the rapid identification of similar patterns at scale. This can be applied across various industries, such as finance, telecommunications, energy management, and transportation.

    
    table.search( 
        {"price": patterns()}, 
        type="tss", 
        n=5, 
        filter=[("=", "sym", "AAPL")], 
        options=dict(force=True, returnMatches=True))
    

    For instance, in finance, Temporal Similarity Search could detect indicative patterns in price and volume data to aid in trading decisions, while in telecommunications, it could predict and prevent network outages by identifying usage patterns. Similarly, energy management benefits from recognizing consumption patterns to optimize distribution, and urban planners could use traffic flow patterns detected through Temporal Similarity Search to reduce congestion.

    Anomaly detection

    Temporal Similarity Search facilitates anomaly detection by identifying patterns that deviate from historical data. For example, it can help recognize changes in customer behavior, prompting proactive outreach in the retail and service sectors. It can detect equipment performance anomalies in manufacturing, preventing failures and downtime. Additionally, it plays a vital role in spotting data quality issues in real-time data feeds and recognizing unusual patterns in sensor data for predictive maintenance. This comprehensive capability makes Temporal Similarity Search a powerful tool for ensuring operational efficiency and strategic decision-making across diverse fields.

    
    table.search( 
        {"price": patterns)}, 
        type="tss", 
        n=-5, 
        filter=[("=", "sym", "NVDA")], 
        options=dict(force=True, returnMatches=True))
    

    Similarity search

    There is also the option to store embedding representations of unstructured data within kdb+ splayed tables. This enables vector similarity searches and Retrieval Augmented Generation for semantically similar data.

    For example, in finance, trading firms could retrieve historical market conditions that resemble the current state for better decision-making. Similarly, engineers could detect quality issues in manufacturing by analyzing maintenance logs and technician reports.

    Integrating kdb+ with KDB.AI allows organizations to maximize the value of their existing data without needing to migrate. It enables semantic search on stored embeddings for unstructured data insights and the rapid identification of patterns, anomalies, and similarities in extensive datasets.

    To learn more, check out our latest documentation, or view our migration guide, and sample on GitHub.

    投稿が見つかりませんでした。

    Unlock new capabilities with KDB.AI 1.4

    KDB.AI 1.4 has just been released, unlocking new capabilities to streamline workflows, boost performance, and open new possibilities for integrating data. In this release, we aim to make KDB.AI even easier to use and more adaptable to the growing demands of diverse applications.

    Let’s explore.

    Database layer support

    To improve data management, KDB.AI 1.4 introduces a new database layer above tables, allowing for better organization and management.

    
    schema = [
        {"name": "id", "type": "str"},
        {"name": "vectors", "type": "float64s"}
    ]
    
    indexes = [
        {
            "name": "vectorIndex", "type": "flat",
            "params": {"dims": 384, "metric": "CS"},
            "column": "vectors"
        }
    ]
    
    table = database.create_table("my_table", schema=schema, indexes=indexes)
    

    Each database can support multiple tables, each with multiple indexes. This helps reduce redundancy and simplifies the management of large datasets in enterprise environments.

    Multiple index support

    For users with diverse datasets, KDB.AI 1.4 introduces enhanced multi-index support:

    • You can now create and manage multiple indexes on a single table, allowing for more flexible and efficient querying strategies
    • You can now execute searches across different indexes simultaneously, enabling more comprehensive and nuanced query results. This is especially beneficial for multimodal datasets, such as images and text. For example, users can search using both an image embedding and a text embedding and then re-rank results accordingly
    
    # Multi-Index Search for both texts and images
    results = table.search(
        vectors={
            "text_index_qFlat": query_vector,
            "image_index_qFlat": query_vector
        },
        index_params={
            "text_index_qFlat": {'weight': 0.5},
            "image_index_qFlat": {'weight': 0.5}
        },
        n=2
    )[0]
    

    Additionally, indexes can have different dimensions, allowing users to experiment with multiple indices and re-rank results based on dimension. This can significantly enhance your ability to conduct complex searches for more accurate results.

    With hybrid search, developers can explicitly define separate indexes: one dense for semantic similarity and another sparse for keyword search. This was possible in previous versions, but with KDB.AI 1.4, we have introduced greater control over indexes and more granular weighting for fine-tuned ranking based on the importance of different data aspects.

    kdb+ integration

    KDB.AI 1.4 also strengthens integration with kdb+

    • Direct table access: Enables users to reference and query kdb+ tables directly from KDB.AI, allowing for seamless similarity searches without needing to move data between systems. This helps maintain data integrity while using KDB.AI ‘s advanced search capabilities
    • TSS searches on kdb+ tables: Support for running Time Series Similarity (TSS) searches on kdb+ tables extends powerful time series analysis capabilities to your existing kdb+ data, enabling better decision-making in financial and IoT applications
    • Index creation on kdb+ data: Create indexes on kdb+ table data within KDB.AI, optimizing vector searches without modifying the original tables. This feature enhances search performance without compromising your existing data structures

    New q API

    We’ve also introduced a fully documented public q API for KDB.AI server that allows q developers to leverage KDB.AI ‘s capabilities directly within their q environment. This provides a seamless integration path for organizations heavily invested in q, reducing friction and providing a consistent toolset for developing advanced applications.

    Enhanced REST API

    The REST API has also been improved for a better developer experience:

    • Improved adherence to RESTful conventions makes the API more intuitive and easier to work with
    • More consistent error handling and response codes improve debugging and error management in applications using the API

    Version information

    Finally, we have included the ability to retrieve information on the KDB.AI server version to aid in compatibility checking and troubleshooting. This helps manage deployments and ensures consistency across environments.

    To learn more, check out our latest documentation on code.kx, or view our migration guide on GitHub.

    KX Community Grows with Thousands of Members Empowers Developers to Solve High-Frequency Large-Volume Data Challenges for AI and Analytics Applications

    KX, a global leader in vector-based and time-series data management, has added thousands of members within the KX Community, emphasizing the growing need for developer friendly education and tools that address high-frequency and large-volume data challenges across structured and unstructured data. Spearheaded by KX’s developer advocacy program, the community increases year-to-year since its inception in January 2022. This growth reflects KX’s commitment to supporting both its long-standing Capital Markets customers and the wider developer community, empowering developers to solve complex, real-world problems in building AI and analytics applications. To complement this initiative, KX has launched KXperts, a developer advocacy program that enables members to deepen their involvement and engage in thought leadership, collaboration and innovation.

    “The developer experience is a core tenant of KX’s culture. We seek opportunities to deepen our connection with the developer community so we can provide a product and environment that delivers ongoing value,” said Neil Kanungo, VP of Product-Led Growth at KX. “The growth of our member base and the increasing engagement of KXperts illustrates that the developers within the builder community are eager to lead, contribute and mentor. We’re proud to provide an open, collaborative environment where developers can grow and work together to solve business challenges more effectively.”

    The KX Community serves as a platform for a wide range of technical professionals, including data engineers, quants and data scientists, to engage in impactful projects and dialogue that support the growth of members, both personally and professionally, as well as influence the broader market. Community members have increasingly leveraged the uniquely elegant q programming language, and, most recently, PyKX, which brings together Python’s data science ecosystem and the power of KX’s time-series analytics and data processing speed. Over 5,000 developers download PyKX daily. The Visual Studio Code extension, that enables programmers to develop and maintain kdb data analytics applications with the popular VS Code IDE, brings a familiar development flow to users, allowing them to adopt KX technology quickly and seamlessly. Combined, these tools improve the accessibility of KX products, making it easier for members to solve complex, real-time data challenges in a multitude of industries, including Capital Markets, Aerospace and Defense, Hi-Tech Manufacturing, and Healthcare.

    The newly launched KXperts program is a unique subcommunity of developer experts who are advocates for KX’s tools and technology. Members of the program unlock opportunities to contribute their expertise to technical content development, research, and events, and provide product feedback that informs KX’s research and development initiatives. Members receive the following benefits:

    • KX Academy – Access to tutorials and educational courses that enable users to become technically proficient in KX architecture, q programming language, PyKX, SQL for kdb, KX Dashboards and the entire KX product suite. By the end of 2024, KX will have released six new free educational courses with certifications, bringing the total to over a dozen.
    • Sandbox Environment – Enables members to trial most KX products and complete exercises, honing their skills and better familiarizing themselves with new product updates without the friction of upgrades or installations.
    • Programming Tools – Developers can utilize KX’s Visual Studio Code extension and PyKX, which is available through popular open-source channels, to achieve flexibility of programming in either Python or q. These tools improve the developer experience by making KX products more intuitive, easier to use, and accessible.
    • Slack Community – Moderated by KX’s in-house developers, this free Slack community connects members with experts and peers who are available to answer questions and engage in meaningful conversations.

    “Those of us within the KXperts program are extremely passionate about the work we do every day and are motivated to further our engagement within the broader developer community,” said Alexander Unterrainer, with DefconQ, a kdb/q education blog. “Since becoming a member, I’ve had the opportunity to participate in speaking engagements alongside the KX team, and share my advice, experience and perspectives with a larger audience than I had access to prior.”

    “Since I began my kdb journey, I’ve sought opportunities to share the lessons I’ve learned with others in the community. KX has supported this since day one,” said Jemima Morrish, a junior kdb developer at SRC UK. “Upon becoming a member of KXperts a couple months ago, I’ve been able to refine my channel so that I can serve more like a mentor for other young developers just kickstarting their career journeys. Helping them learn and grow has been the most fulfilling benefit.”

    “I have become extremely proficient in the q programming language and kdb+ architecture thanks to the resources available from KX,” said Jesús López-González, VP Research at Habla Computing and a member of KXperts. “I’ve also had the opportunity to produce technical content hosted within the KX platform, and lead meetups, better known as ‘Everything Everywhere All With kdb/q,’ where I’ve contributed guidance to KX implementation and how to use the platform to address common challenges.”

    The robust, active community is an added benefit to business leaders who prioritize onboarding technical solutions that support their development teams in streamlined onboarding of technology and continued advancement and proficiency. While the community continues to reach new growth milestones, this marks a significant step forward in the company’s efforts to scale and reach new developers, positioning KX as an increasingly accessible and open platform.

    Register for the KX Community, apply for the KXperts program or join the Slack Community to start your involvement with the growing developer member base.

    To learn more about all resources available to the developer community, please visit the Developer Center: https://kx.com/developer/

    KXperts: The role of kdb+ in quantitative research 

    Imagine you’re a quant researcher, grappling with streams of real-time financial data, billions of rows deep. Every second counts and your algorithms need to keep up with fluctuating markets. You need fast, powerful analytics to stay ahead. This is where kdb+ steps in.

    In our recent KXperts Livestream, KX Developer Advocate, Michaela Woods and Emanuele Melis, Principal Data Engineer at Talos (and Black Tier member of the KXpert program), explored how kdb+ is revolutionizing quantitative research in the financial services industry (FSI). 

    Watch the KXperts Livestream below: 

    Here are the top five insights from the session to help your team harness the full potential of kdb+: 

    1. Unified data processing for real-time and historical analytics 

    For quant researchers, the ability to work seamlessly across real-time and historical data is crucial. kdb+ brings this unique capability to the table, eliminating the need for multiple systems. Whether you’re analyzing market trends or backtesting, you can do it all within a single platform, boosting your team’s efficiency and accuracy. 

    Emanuele: “If you’re looking for a single piece of technology that can do both historical and real-time analysis, kdb+ is the de facto standard in the industry.” 

    “We went through a period where firms were looking for the next big technology that would revolutionize finance, but what we’ve realized is that kdb+ and Python are the two pillars of modern quantitative research.” 

    2. Efficient code, fewer errors 

    In fast-paced environments like trading, coding efficiency can directly impact performance. With its concise syntax, kdb+ minimizes code complexity while maintaining robust functionality. This translates to fewer bugs and a smoother development process, helping your quants focus on what matters—delivering results. 

    Michaela: “People think Q and kdb+ are scary, but it’s quite intuitive. It reduces the chances for bugs and errors.” 

    3. Streamlined Transaction Cost Analysis (TCA) 

    Transaction costs can significantly impact your profitability, and accurate transaction cost analysis (TCA) is essential for making informed decisions. kdb+ simplifies TCA through its powerful time-series functions like the “as-of join,” which quickly matches trades with prevailing quotes. This gives quants a more precise view of market conditions at the time of execution. 

    Emanuele: “The as-of join function allows you to find the prevailing quote at the time of a trade, a critical component for TCA.” 

    4. Real-time options trading at scale 

    Options trading requires real-time insights to capture fleeting market opportunities. kdb+ excels in processing high-volume options data, often billions of rows per day, while running advanced pricing models like Black-Scholes or Monte Carlo simulations in real-time. This ensures that traders are always ready to act on the most up-to-date market information. 

    Emanuele: “In options trading, you need to be in the market at the right time, at the right place.” 

    Michaela: “kdb+ makes it easy to ingest and process vast amounts of streaming data in real time, while also maintaining high performance across historical datasets.” 

    5. Flexible integration with mainstream technologies 

    Flexibility is key in financial services, where systems often need to integrate with multiple tools and platforms. kdb+ offers integration via fusion interfaces, allowing teams to connect kdb+ with formats like arrow, kafka, and LDAP. This means developers can maintain their existing workflows while leveraging the power of kdb+ where it matters most. 

    Emanuele: “You can integrate kdb+ with almost any mainstream technology which gives development teams the flexibility to choose the best tool for the job.

    Learn more about kdb+ here. For technical resources associated with kdb+ head to our Developer Center where you can find our extensive documentation, take courses on KX Academy, and join our developer community. Join the community slack here.

    Applications are open for our Developer Advocacy Program, ‘Community KXperts’! This program is ideal for anyone passionate about sharing their knowledge on KX through blogs, articles, or other content. To apply, contact evangelism@kx.com.

    投稿が見つかりませんでした。

    Seven ways kdb+ powers advanced quantitative research 

    KX Developer Advocate, Michaela Woods, shares seven key resources that outline how kdb+ is enhancing quantitative research to harness data and transform it into actionable insights.

    Quantitative research in finance relies on tools like kdb+ to handle large data volumes and complex analyses, providing insights essential for effective trading strategies in modern markets.  

    The ability to analyze vast amounts of data, apply complex mathematical models, and derive actionable insights are crucial to be successful as a modern-day quant. 

    kdb+ has long been used to address the complex challenges of quantitative research, providing unmatched performance in analytics and real-time data processing. In this article, I share seven resources demonstrating how kdb+ and KX technology can be leveraged to solve various quantitative research problems.  

    1. Pairs trading

    Link: Analyzing Pairs Trading Strategies with kdb+/q  

    This article explores the implementation and analysis of pairs trading strategies using kdb+/q. Pairs trading is a market-neutral strategy that involves trading two correlated financial instruments, betting on the convergence or divergence of their price spreads. Concepts covered include:  

    • Co-integration testing: Co-integration is a statistical property indicating that the price series of two assets move together over time. If the assets are cointegrated, it suggests that their price spread is likely to revert to the mean, making them suitable candidates for pairs trading.  
    • Spread calculation: The price spread between the two assets is calculated once co-integration is established. Monitoring this spread helps identify trading signals— a trade is initiated when the spread deviates significantly from the mean.  
    • Trade execution: The strategy involves executing trades when the spread crosses certain thresholds. For instance, when the spread widens beyond a predetermined level, the plan might include shorting the overperforming asset and going long on the underperforming one, anticipating a reversion to the mean.  
    • Backtesting: The article emphasizes the importance of backtesting the pairs trading strategy using historical data, ensuring its robustness before applying it to live markets.  

    The article serves as a valuable resource for quantitative researchers and traders interested in implementing pairs trading strategies using kdb+. It offers practical insights into the entire process, from data collection to backtesting, with a focus on optimizing strategy performance through real-time data integration.  

    2. Trend indicators  

    Link: Trend Indicators in kdb+  

    This whitepaper delves into implementing trend indicators using kdb+/q, focusing on popular indicators like Moving Average Convergence Divergence (MACD), Relative Strength Index (RSI), and Bollinger Bands. These indicators are widely used in quantitative research to identify potential trends and market conditions.  

    • MACD: The article walks through how to calculate the MACD by taking the difference between the 12-day and 26-day Exponential Moving Averages (EMAs) and plotting it along with a 9-day EMA of the MACD itself.  
    • RSI: It covers the computation of the RSI, a momentum oscillator that measures the speed and change of price movements, helping to identify overbought or oversold conditions.  
    • Bollinger bands: This section explains how to create Bollinger Bands, which consist of a moving average and two standard deviations plotted above and below the moving average, providing a visual representation of volatility.  

    It provides both the theory behind each indicator and practical examples of how to implement them in kdb+/q, making it a valuable resource for quantitative researchers looking to enhance their market analysis strategies with trend indicators.  

    3. Option pricing models: Monte Carlo and Black-Scholes  

    Link: Option Pricing in kdb+   

    This whitepaper explores the implementation of option pricing models using kdb+/q, with a focus on the Black-Scholes model and Monte Carlo simulations, two widely used methods in quantitative finance.  

    • Black-Scholes model: the article begins by explaining the fundamentals of the black-scholes model, a closed-form solution used to calculate the theoretical price of European options. It covers the key parameters like the spot price, strike price, volatility, risk-free rate, and time to maturity. The article then demonstrates how to implement the Black-Scholes formula in kdb+/q, offering code snippets and explanations for each step.  
    • Monte Carlo simulations: the article also delves into Monte Carlo simulations, which are used to model the probability of different outcomes in option pricing by running a large number of random simulations. It explains how to set up these simulations in kdb+/q, generate random paths for asset prices, and use these paths to estimate option prices.  
    • Comparison and practical applications: finally, the article compares the two methods, highlighting the strengths and limitations of each approach. It also discusses practical considerations when applying these models in real-world scenarios, such as computational efficiency and handling large datasets.  

    This resource is particularly valuable for quantitative researchers and financial analysts interested in implementing advanced option pricing models using kdb+/q.  

    4. Analyzing market depth  

    Link: Market Depth Analysis in kdb+  

    This article focuses on analyzing market depth data using kdb+/q, a critical aspect of understanding order book dynamics in financial markets. Market depth refers to the ability of a market to absorb large orders without significantly impacting the price, and it is visualized through the order book, which displays the buy and sell orders at different price levels.  

    • Capturing and Storing Market Depth Data: The article provides insights into how market depth data can be captured and stored efficiently using kdb+/q. It discusses the challenges of handling the high-frequency nature of this data and offers strategies for optimizing data storage and retrieval.  
    • Analyzing Market Depth: It covers techniques for calculating the market’s liquidity, identifying patterns in order flow, and detecting potential signs of market manipulation. It also suggests methods for plotting the order book and interpreting these visualizations to make informed trading decisions.  

    This resource is particularly useful for quantitative researchers and traders who need to analyze market-depth data to better understand liquidity and order book dynamics.   

    5. Transaction cost analysis  

    Link: Transaction Cost Analysis in kdb+  

    This article discusses the implementation of Transaction Cost Analysis (TCA) using kdb+/q, an essential process in assessing the costs associated with trading activities. TCA helps traders and quantitative researchers understand and minimize the costs incurred when executing trades, which can significantly impact overall portfolio performance.  

    • Components of TCA: The article details the critical components of TCA, including:  
    • In-Trade Analysis: Monitoring costs as trades are executed.  
    • Post-trade analysis: Analyzing the actual costs incurred after trades have been completed.  
    • Implementing TCA in kdb+: It provides examples of how to calculate key metrics such as the Effective Spread, Implementation Shortfall, and Market Impact using kdb+/q. The article explains how to gather the necessary data, process it efficiently, and compute these metrics to gain insights into trading costs.  

    This article is a valuable resource for quantitative researchers and trading professionals who are looking to implement robust TCA processes using kdb+/q.  

    We also have a Jupyter Notebook available on the KX Academy showcasing TCA with PyKX.  

    6. Leveraging order book data   

    Link: Order Book Analysis in kdb+  

    This article covers the analysis of order books using kdb+/q, a critical component for understanding market behavior and price formation in electronic trading environments. The order book is a real-time list of buy and sell orders for a specific financial instrument, providing insight into market depth and liquidity.  

    • Order book metrics and analysis: the core of the article is dedicated to various metrics and analyses that can be performed on order book data using kdb+/q. These include:  
    • Order flow: tracking the sequence and size of orders to understand buying and selling pressure.  
    • Liquidity measures: calculating the total volume available at different price levels to assess market depth.  
    • Price impact: analyzing how large orders affect price movements and identifying potential market impact.  
    • Order book imbalance: measuring the difference between bid and ask volumes to gauge the likely direction of price movement.  

    This article is an essential resource for quantitative researchers and traders interested in leveraging kdb+/q for detailed order book analysis. It offers both theoretical insights and practical tools for making sense of complex market data.   

    7. Active vs. Passive strategies with kdb insights enterprise  

    Link: Create powerful analytics with kdb insights enterprise  

    This tutorial guides you through creating a trade signal and analyzing market positions using kdb Insights Enterprise, specifically for financial applications, offering examples such as:  

    • Moving averages for trade signals: the strategy calculates two simple moving averages—a fast (short-term) and a slow (long-term). A ‘buy’ signal is generated when the fast moving average crosses above the slow one, and a ‘sell’ signal is triggered when the reverse occurs.  
    • Position tracking: based on the crossover of these moving averages, positions are tracked using a new variable, positions. The position is set to +1 for a buy signal and -1 for a sell signal. Additionally, the logarithmic return on the price is calculated to analyze performance.  
    • Active vs. Passive strategy comparison: the final step involves comparing the active strategy (based on the moving averages) to a passive strategy, such as tracking an index like the S&P 500. The comparison is visualized to determine which strategy performs better, with the active strategy typically showing superior performance.   

    Streaming live tick data alongside historical data provides a comprehensive view of the market, enabling you to maximize opportunities. This tutorial demonstrates how kdb Insights Enterprise can be used to build and visualize powerful, real-time trading analytics, offering a detailed comparison between active and passive investment strategies while optimizing your market insights.  

    By exploring these resources, you can deepen your understanding of quantitative research techniques and leverage kdb+ and KX technology to develop more sophisticated and effective trading strategies.

    Learn Connect Build
    Hone your understading of kdb+ at the KX Academy
    Enrol now
    Get faster responses to your questions from KX and community experts
    Join now
    Get hands-on with our extensive documentation and support portal.
    Explore now

    To learn more about kdb+ click here. To discover how KX is helping financial services organizations optimize trading, risk analytics, and decision-making click here.

    投稿が見つかりませんでした。

    Book a Demo Azure

    Demo the world’s fastest database for vector, time-series, and real-time analytics

    Start your journey to becoming an AI-first enterprise with 100x* more performant data and MLOps pipelines. 

    kdb Insights Enterprise on Microsoft Azure is ideal for scalable quant research in the cloud and supports SQL and Python with unparalleled speed. Data-driven organizations choosing KX for faster decision making:

    Book your personal demo


      By submitting this form, you will also receive sales and/or marketing communications on KX products, services, news and events. You can unsubscribe from receiving communications by visiting our Privacy Policy. You can find further information on how we collect and use your personal data in our Privacy Policy.

      *required

      A Verified G2 Leader for Time-Series Vector Databases

      4.8/5 Star Rating

      G2 Stars - KX
      G2 Stars - KX
      G2 Stars - KX
      G2 Stars - KX
      G2 Stars - KX

      Based on time-series queries running in real-world use cases on customer environments.

      To see how kdb performed in independent benchmarks that show similar on replicable data see: TSBS 2023STAC-M3DBOps, and Imperial College London Results for High-performance DB benchmarks.

      The ultimate guide to choosing embedding models for AI applications

      Lockheed Martin’s Skunk Works and KX Shaping the Future of Open Mission System Architectures

      Today, at the Farnborough Air Show, Skunk Works®, the renowned Advanced Development Programs division of Lockheed Martin (NYSE: LMT) and KX, a global leader in vector-based, time-series data management, announced a new collaboration focused on the evolution of Open Mission System architectures.

      KX has engaged with Skunk Works to combine kdb+, the world’s fastest analytical database for time-series data, with Lockheed Martin’s leading-edge and next-generation AI and data tooling technologies. KX has cornerstone locations in the United Kingdom and the formal collaboration will create a UK-sovereign, real-time situational awareness model that can be applied across the armed forces for combined joint all-domain command and control (CJADC2), which will allow for greater connectivity, coordination, and faster access to data for enhanced decision-making and operational agility.

      The two organisations have been experimenting and showcasing innovation and competitive advantage in the provision of real-time, data-driven decision-making capabilities that allow operational users to respond more quickly to threats in theatre.

      These collaborative efforts evidence Lockheed Martin’s commitment to partnering with UK industry, and all allies, to demonstrate interoperability with international sovereign systems.

      “Skunk Works has a long history of innovation and incorporating cutting-edge technologies into our systems”, said Atherton Carty, vice president of business development at Skunk Works. “Our work with KX is part of an initiative to add unique capabilities to our systems through expanded relationships with specialized industry suppliers. Skunk Works develops solutions that keep our customers ahead of ready, leveraging the expertise of in-country companies to build stronger alliances as a key enabler for us to support our domestic and international customers’ mission needs.”

      “Today marks a major milestone for KX,” said Gary Connolly, vice president aerospace, defence and space at KX. “Skunk Works continuously pushes the technological boundaries of performance and innovation, while KX has a proven ability to deliver unmatched value to those who operate in the toughest data management environments. Together, we endeavour to make data more accessible, enhance operational decision-making at scale, and deliver information to the warfighter exactly when it’s needed.”

      About Lockheed Martin

      Lockheed Martin is a global defense technology company driving innovation and advancing scientific discovery. Our all-domain mission solutions and 21st Century Security® vision accelerate the delivery of transformative technologies to ensure those we serve always stay ahead of ready. More information at Lockheedmartin.com.

      Benchmark Report – High Frequency Data Benchmarking Confirmation

      Your Report Awaits

      Please use this link at any time to access the report “Benchmark Report – High Frequency Data Benchmarking”.

      Demo the world’s fastest database for vector, time series and real-time analytics


        For information on how we collect and use your data, please see our privacy notice. By clicking “Download Now” you understand and accept the terms of the License Agreement and the Acceptable Use Policy.

        Benchmark Report: High-Frequency Data Benchmarking

        Book a Demo AWS

        KX and AWS Logos - KX

        Demo the world’s fastest database for vector, time-series, and real-time analytics

        Start your journey to becoming an AI-first enterprise with 100x* more performant data and MLOps pipelines. 

        kdb Insights on AWS is ideal for scalable quant research in the cloud and supports SQL and Python with unparalleled speed. Seamless integration with AWS services, like Lambda, S3, and Redshift, empowers you to create a highly performant data analytics solution built for today’s cloud and hybrid ecosystems. Data-driven organizations choosing KX for faster decision making:

        Book your personal demo


          By submitting this form, you will also receive sales and/or marketing communications on KX products, services, news and events. You can unsubscribe from receiving communications by visiting our Privacy Policy. You can find further information on how we collect and use your personal data in our Privacy Policy.

          *required

          A Verified G2 Leader for Time-Series Vector Databases

          4.8/5 Star Rating

          G2 Stars - KX
          G2 Stars - KX
          G2 Stars - KX
          G2 Stars - KX
          G2 Stars - KX

          Based on time-series queries running in real-world use cases on customer environments.

          To see how kdb performed in independent benchmarks that show similar on replicable data see: TSBS 2023STAC-M3DBOps, and Imperial College London Results for High-performance DB benchmarks.

          Book a Demo

          Demo the world’s fastest database for vector, time-series, and real-time analytics

          Start your journey to becoming an AI-first enterprise with 100x* more performant data and MLOps pipelines. 

          Data-driven organizations trust KX for faster decision-making

          J.P. Morgan Logo
          Morgan Stanley
          UBS
          Syneos Health
          Medtronic
          ALPINE

          Book your personal demo


            このフォームを送信することで、KXの製品、サービス、ニュース、イベントに関するセールスおよび/またはマーケティング情報を受け取ることもできます。個人情報保護方針(Privacy Policy)をご覧になれば、配信を停止することができます。個人情報の収集および使用方法については、プライバシーポリシーをご覧ください。

            *必須

            A Verified G2 Leader for Time-Series Vector Databases

            4.8/5 Star Rating

            G2 Stars - KX
            G2 Stars - KX
            G2 Stars - KX
            G2 Stars - KX
            G2 Stars - KX

            Based on time-series queries running in real-world use cases on customer environments.

            To see how kdb performed in independent benchmarks that show similar on replicable data see: TSBS 2023STAC-M3DBOps, and Imperial College London Results for High-performance DB benchmarks.

            Turbocharging Data Analytics with KX on Databricks

            Data analysts know, that whether in finance, healthcare, manufacturing or any other industry, efficient handling of time series data helps derive better decision making and enhanced business intelligence. The process however can often be cumbersome and resource intensive due to language limitations, code complexity and high-dimensional data.

            In this blog, we will explore the partnership between KX and Databricks and understand how the technologies complement each other in providing a new standard in quantitative research, data modelling and analysis.

            Understanding the challenge

            SQL, despite its widespread use, often stumbles when interrogating time-based datasets, struggling with intricate temporal relationships and cumbersome joins. Similarly, Python, R, and Spark drown in lines of code when faced with temporal analytics, especially when juggling high-dimensional data.

            Furthermore, companies running on-premises servers will often find that they hit a computational ceiling, restricting the types of analyses that can be run. Of course, procurement of new technology is always possible, but that often hinders the ability to react to fast paced market changes.

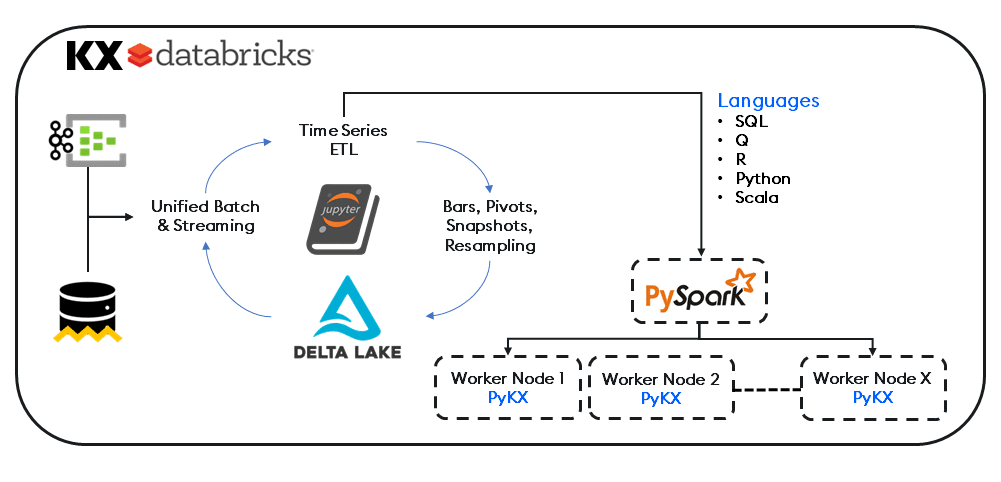
            By leveraging the lightning-fast performance of kdb+ and our Python library (PyKX), Databricks users can now enhance their data-driven models directly within their Databricks environment via our powerful columnar and functional programming capability, without requiring q language expertise.

            Integrating into PySpark and existing data pipelines as an in-memory time-series engine, KX eliminates the need for external dependencies, connecting external sources to kdb+ using PyKX, Pandas or our APIs. And with direct integration into the Databricks Data Intelligence Platform, both Python and Spark workloads can now execute on native Delta Lake datasets, analysed with PyKX for superior performance and efficiency.

            The net result is a reduction in hours spent with on-premises orchestration, efficiencies in parallelization through Spark and prominent open-source frameworks for ML Workflows.

            In a recent transaction cost analysis demo, PyKX demonstrated 112x faster performance with 1000x less memory when compared to Pandas. This was working with Level 1 equities and trade quotes sourced from a leading data exchange and stored natively in Databricks on Delta Lake.

            SyntaxAvg TimeAvg DevrunsloopsTotal MemoryMemory Increment
            Pandas2.54 s24.7 ms713752.16 Mib1091.99 Mib
            PyKX22.7 ms301 us7102676.06 Mib1.16 Mib

            These results show a remarkable reduction in compute resource and lower operating costs for the enterprise. Analysts can import data from a variety of formats either natively or via the Databricks Data Marketplace, then use managed Spark clusters for lightning-fast ingestion.

            Other Use Case Examples

            • Large Scale Pre and Post Trade Analytics
            • Algorithmic Trading Strategy Development and Backtesting
            • Comprehensive Market Surveillance and Anomaly Detection
            • Trade Lifecycle and Execution Analytics
            • High Volume Order Book Analysis
            • Multi-Asset Portfolio Construction and Analysis
            • Counterparty Risk Analysis in High-Volume Trading Environments

            In closing, the combined strengths of KX and Databricks offer significant benefits in data management, sophisticated queries, and analytics on extensive datasets. It fosters collaboration across departments by enabling access to a unified data ecosystem used by multiple teams. And by integrating ML algorithms into the vast datasets managed with Databricks Lakehouse, analysts can uncover more profound and timely insights, predict trends, and improve mission-critical decision making.

            To find out more, read the blog: “KX and Databricks Integration: Advancing Time-series Data Analytics in Capital Markets and Beyond” or download our latest datasheet.

            投稿が見つかりませんでした。

            Introducing The KX Delta Platform 4.8.1

            Built on top of kdb+, the world’s fastest time-series database, the KX Delta Platform enables enterprises to design, build and deploy, highly performant data capture & processing systems that meets today’s demanding security standards. With out of the box LDAP authorization, data encryption and permission control, the KX Delta platform is also subjected to regular code security review and remediation. Our latest update includes several new innovations, including integration of kdb+ 4.1, object storage as an option for the Historical Database (HDB), our Python interface (PyKX) and SQL.

            Let’s explore.

            The KX Delta Platform consists of the following key components.

            DashboardsAn easy-to-use, drag and drop visualization tool.
            AnalystAn enterprise grade visual environment with identity and access management to manage, manipulate and explore massive datasets in real-time.
            Control & StreamA client-server application to design, build, deploy and manage data capture/streaming systems.  Including access control, entitlement, and encryption.
            kdb+A time-series vector database (TSDB) with in-memory (IMDB) capabilities to provide data scientists and developers with a centralized high-performance solution for real-time and multi-petabyte datasets.

            The latest updates to kdb+ (v4.1) include significant advancements in performance, security, and usability, empowering developers to turbo charge workloads, fortify transmissions and improve storage efficiency.

            Updates include:

            To find out more: please read out blog: Discover kdb+’s New Features on kx.com

            PyKX and SQL Integration

            For Python developers, the integration of PyKX into the Delta Platform unlocks the speed and power of kdb+ for data processing and storage. It empowers Python developers (e.g. Data Scientists) to apply analytics (using PyKX library functions) against vast amounts of data, both in memory and on disk in a fraction of the time when compared to standard Python environments. Similarly, for q developers, the integration of PyKX opens the door to a wealth of new data science workloads and Python based analytics.

            ANSI SQL introduces a full relational database management system (RDBMS) for end users not proficient in q. Support is included for Operators, Functions, Data and Literals, Select Statements, Table Creation, Modification and Deletion.

            To find out more or enrol on one of our PyKX/SQL courses, please visit the KX Learning Hub

            Persisting the HDB to object storage

            In a typical kdb+ architecture, end of day data is persisted to the Historical Database (HDB) to free system memory. Over time the size of the HDB and its associated storage can be significant. To help manage costs, the KX Delta Platform can now offer object storage as an option, providing a new modality for inexpensive, durable, long-term storage strategies. This offers the benefits of highly available and infinitely scalable cloud-based solutions and ensures that enterprise customers can still retrieve long-term historical datasets.

            Typical Use Cases

            The KX Delta Platform supports the rapid development of kdb+ powered solutions with the hardening needed in a secure, on-prem platform.

            • Data integration and fusion​​: Integrate and analyze data from multiple intelligence sources to create a comprehensive data landscape of subversive activities and networks.
            • Real-time intelligence and analysis​​: Process and analyze data in real time using multiple data streams to identify threats and respond quickly.
            • Pattern recognition and anomaly detection​​: Analyze historical and current data to identify patterns, trends, and anomalies.

            To find out more contact sales@kx.com

            投稿が見つかりませんでした。

            PyKX open source, a year in review

            Initially conceived as a comprehensive integration between Python and kdb+/q PyKX has gone from strength-to-strength both in terms of user adoption and functionality since the first lines of code were written in January 2020. During the first years of development, PyKX was a closed source library available to clients via closely guarded credentials unique to individual organisations.

            In May of last year this changed when we announced PyKX as an open source offering available via PyPi and Anaconda, with the source code available on Github. Since then, across these two distribution channels the library has been downloaded more than 200,000 times.

            In this blog we will run through how the central library has evolved since that initial release in response to user feedback.

            What’s remained consistent?

            Since initial release the development team have taken pride in providing a seamless developer experience for users working at the interface between Python and q. Our intention is to provide as minimal a barrier for entry as possible by providing Python first methods without hiding the availability and power of q. Coupled with this the team has been striving to make PyKX the go-to library for all Python integrations to q/kdb+.

            These dual goals are exemplified by the following additions/changes since the open-source release:

            • PyKX under q as a replacement of embedPy moved to production usage in Release 2.0.0
            • Addition of License Management functionality for manual license interrogation/management alongside a new user driven licenses installation workflow outlined here. Additionally expired or invalid licenses will now prompt users to install an updated license.
            • When using a Jupyter Notebooks, tables, dictionaries and keyed tables now have HTML representations increasing legibility.
            • PyKX now supports kdb+ 4.1 following the release on February 13th 2024

            What’s changed?

            Since being open-sourced, PyKX has seen a significant boost in development efforts. This increase is due to feedback on features from users and responses to the issues they commonly face. A central theme behind requests from clients and users has been to expand the Python first functionality provided when interacting with PyKX objects and performing tasks common for users of kdb+/q.

            This can be seen through additions in the following areas:

            • Increases in the availability of Pandas Like API functionality against “pykx.Table” objects including the following methods: merge_asof, set_index, reset_index, apply, groupby, agg, add_suffix, add_prefix, count, skew and std.
            • Interactions with PyKX vectors and lists have been improved considerably allowing users to:
            • PyKX atomic values now contain null/infinity representations making the development of analytics dependent on them easier. In a similar vein we have added functionality for the retrieval of current date/time information. See here for an example.
            • In cases where PyKX does not support a type when converting from Python to q we’ve added a register class which allows users to specify custom data translations.
            • The addition of beta features for the following in PyKX
              • The ability for users to create and manage local kdb+ Partitioned Databases using a Python first API here.
              • The ability for users with existing q/kdb+ server infrastructure to remotely execute Python code on a server from a Python session. Full documentation can be found here.  

            What’s next?

            The central principles behind development of the library haven’t changed since our initial closed source release and the direction of development will continue to be driven by user feedback and usage patterns that we see repeated in client interactions. On our roadmap for 2024 are developments in the following areas:

            1. Streaming use-cases allowing users in a Python first manner to get up and running with data ingestion and persistence workflows.
            2. Enhancements to the performance of the library in data conversions to and from our supported Python conversion types.
            3. Expansion to the complexity of data-science related functions and methods supported by PyKX to allow for efficient data analysis.

            Conclusion

            Over the last year, significant progress in the library has greatly enhanced PyKX’s usability. This progress was largely influenced by daily interactions with the development community using PyKX. By making the library available on PyPi, Anaconda, and the KX GitHub, we’ve accelerated development and deepened our understanding of what users want to see next with PyKX.

            If you would like to be involved in development of the library, I encourage you to open issues for the features that you would like to see or to open a pull request to have your work incorporated in an upcoming release.

            投稿が見つかりませんでした。

            KX for Databricks

            Benchmarking Specialized Databases for High-frequency Data

            In the era of big data, industries such as finance and manufacturing generate large volumes of time series data every day. This data, unlike classical relational data, is updated more frequently, with new data points continuously generated. This necessitates the need for specialized time series databases that meet the stringent requirements of read/write throughput and latency.

            In a recent paper titled “Benchmarking Specialized Databases for High-frequency Data” researchers Fazl Barez (University of Edinburgh), Paul Bilokon, and Ruijie Xiong (Imperial College London) conducted a comprehensive performance benchmark evaluation of four specialized solutions: ClickHouse, InfluxDB, kdb+, and TimescaleDB.

            Setup

            Using a personal PC, equipped with an Intel i7-1065G7 CPU and 16GB of RAM, the researchers defined a scenario in which each database would be evaluated to store trade and order book records derived from a 25GB cryptocurrency feed.

            Benchmarks were divided into five categories: Trades, Order Book, Complex Queries, Writing, and Storage Efficiency.

            • The Trades category included calculations on trades data commonly used in the industry such as average trading volume and Volume Weighted Average Price (VWAP)
            • The Order Book category involved actions and analysis of the order book data that are frequently used such as bid/ask spread and National Best Bid and Offer (NBBO)
            • Benchmarks that required complicated queries with joins and nested queries such as mid-quote returns were classified in the Complex Query category.
            • The remaining categories focused on “Bulk Writing” tasks and “Storage Efficiency”

            The main metric for each benchmark was the query latency, or the amount of time between sending the query to the server and receiving the results. Query latency was derived from the built-in timers of each database solution.

            The process was automated via Python, which made a connection with the database hosted on the local machine. All databases saved their data in SSD and adequate memory was made available during execution. It should be noted that each database was tested individually, and results were based on the average result from 10 executions.

            Results

            As illustrated in the table below, the results of the experiment concluded that kdb+ had the best overall performance among all tested solutions and therefore the most suitable database for financial analysis application of time series data.

            kdb+ was able to quickly ingest data in bulk, with good compression ratios for storage efficiency. It also demonstrated low query latency for all benchmarks including read queries, computationally intensive queries, and complex queries.

            Benchmark kdb+ InfluxDB TimescaleDB ClickHouse
             Query Latency (ms)
            Write perf (day trades\order book data to persistent storage) 33889 324854 53150 765000
            Avg trading volume 1 min\Day 81 93 469 272
            Find the highest bid price in a week 94 146 3938 962
            National Best Bid and Offer for day 34 191 1614 454
            Volume Weighted Average Price 1 min\Day 75 12716 334 202
            Bid/Ask spread over a day 1386 623732 2182 14056
            Mid-quote returns 5 min\Day 113 99 1614 401
            Volatility as standard deviation of execution price returns 5 min\Day 51 2009 324 190


            STAC-M3 Financial Services Benchmarking

            Tested to be 29x faster than Cassandra and 38x faster than MongoDB, Kdb+ holds the record for 10 out of 17 benchmarks in the Antuco suite and 9 out of 10 benchmarks for the Kanaga suite in the STAC-M3 benchmark, the industry standard for time series data analytics benchmarking in financial services.

            STAC-M3 represents one of the only truly independently audited set of data analytics benchmarks available to the financial services industry and acts as a valuable service to FSI businesses by “cutting through” the proprietary technical marketing benchmarks available from each technology vendor.


            Typical Kdb+/tick Architecture:


            The kdb+/tick architecture is designed from the ground up to capture, process, and analyse real-time and historical data.

            • Data is ingested by a feed handler, which translates the content into a kdb+ format.
            • A Tickerplant receives the formatted data and writes to the log file, real-time subscriber, and real-time database.
            • Intraday data is persisted to the historical database at the end of the day, and the real-time database is flushed along with the log file to accept new data.
            • A gateway is used to handle user queries to the database. (This could be in the form of real-time, historical, or a combination of both).

            The superior performance of kdb+ in handling high-frequency data underscores the importance of choosing the right database for time-series analysis. And with our latest updates, we have once again pushed the boundaries of speed, achieving an additional 50% reduction in ingestion times through multithreaded data loading and a fivefold increase in performance when working with high-volume connections.

            Read the paper here: [2301.12561] Benchmarking Specialized Databases for High-frequency Data (arxiv.org) then try it yourself by signing up for your free 12-month personal edition of kdb+


            Related Resources

            投稿が見つかりませんでした。

            Seven Innovative Trading Apps and Seven Best Practices You Can Steal

            Quant Trading Data Management by the Numbers

            Turbocharging the Engine: KX Unleashes AI-First Transformation with kdb

            Turbocharging the Engine: KX Unleashes AI-First Transformation with kdb

            Performance and efficiency gains at heart of world’s fastest analytical database for time series, IOT/sensor data

            KX, a global leader in high performance analytical databases and vector-based data management, has announced substantial improvements to kdb+, the foundation of the company’s ability to bring time-oriented data insights and generative AI capabilities to the world’s leading enterprises.

            Recognized as the fastest in-memory, columnar analytics database, kdb+ has served as the core engine of all KX products since its inception, delivering unmatched value to customers who operate in the toughest data management environments–financial markets. The latest version of kdb+ stays true to its roots by enabling users to ingest and analyze data faster, take advantage of AI capabilities, and securely scale to allow for management of more data than ever before.

            “For three decades, kdb+ has been at the core of our innovation, empowering the transformation of data into actionable insights. This new version of kdb+ reaffirms our commitment to delivering simplicity, performance, and efficiency across the KX product suite, driving forward the AI-first ambitions of global organizations. It also celebrates our dedication to the vibrant kdb+ user community, whose loyalty and passion have been instrumental in shaping the evolution of our products,” said Ashok Reddy, CEO at KX.

            The latest enhancements to kdb+ are designed to efficiently manage and analyze the vast datasets needed for generative AI with unparalleled efficiency and scalability. As the powerhouse behind the kdb Insights suite and KDB.AI, kdb+ provides organizations with the agility to navigate rapidly fluctuating market dynamics through expedited decision-making processes. These processes are fueled by advanced predictive analytics models that integrate both structured and unstructured data sources. Customers will realize significantly faster data ingestion rates, enhanced query execution speeds, and a marked decrease in storage expenditure.

            “I’m particularly excited for our customers to experience new features, such as work-stealing, unified thread-scheduler, and the increased capacity for network connections,” said Charles Skelton, KX Chief Scientist. “At a developer level, I’m certain our community will enjoy the new language features around pattern matching that we previewed at our user conference in 2023.”

            Notable improvements to kdb+ include:

            Multi-threaded CSV Parser: Halves time-series data ingestion times, enabling faster analysis and quicker updates to AI models, both of which are crucial for real-time decision-making.

            Peach with Work-Stealing Algorithm: Increases query execution speed by 30%, enhancing the performance of complex query executions and AI model computations.

            Unlimited Network Connections: Allows for scalability to one million+ connections, delivering robust performance in high-volume time series data environments and AI applications.

            HTTP Persistent Connections: Reduces connection overhead significantly, facilitating real-time data processing and enhancing the efficiency of data exchanges.

            Enhanced TLS and OpenSSL: Provides secure, encrypted data transmission to ensure trust and compliance deemed crucial for regulated industries.

            Additional algorithms for at-rest compression: Reduces storage costs while maintaining accessibility and optimizing data storage for AI operations, without compromising data access speed.

            “This version of kdb+ turbocharges our commitment to differentiation in the name of customer value and reaffirms our position at the forefront of the industry. We look forward to continuing to push boundaries and set new standards in high-performance analytics databases for time series and IoT/Sensor data management,” said Reddy.

            Kdb+ optimizes storage, ensures secure data transmission, streamlines data transfer processes, increases data connection scalability, enhances query execution performance and accelerates time series data ingestion. The time series database utilizes the powerful Q programming language, as well as Python and SQL, and is known for its high-performance, in-database analytic capabilities, holding 15 of 17 world records in STAC benchmarks. Kdb+ is the engine that powers critical missions for enterprises across the world and, time and again, has set the standard for transformational AI solutions.

            To learn more about kdb+ 4.1 and to get started today, please visit: https://kx.com/products/kdb/

            KDB+ Data Sheet

            Explore the key features and benefits of world’s fastest time-series database and analytics engine.

            Discover kdb+ 4.1’s New Features

            With the announcement of kdb+ 4.1, we’ve made significant updates in performance, security, and usability, empowering developers to turbo charge workloads, fortify transmissions and improve storage efficiency. In this blog, we’ll explore these new features and demonstrate how they compare to previous versions.

            Let’s begin.

            Peach/Parallel Processing Enhancements

            “Peach” is an important keyword in kdb+, derived from the combination of “parallel” and “each”. It enables the parallel execution of a function on multiple arguments.
            In kdb+ 4.1 the ability to nest “peach” statements now exists. Additionally, it no longer prevents the use of multithreaded primitives within the “peach” operation.

            It also introduces a work-stealing algorithm technique in which idle processors can intelligently acquire tasks from busy ones. This marks a departure from the previous method of pre-allocating chunks to each thread, and with it, better utilization of CPU cores, which in our own test have resulted in significant reductions in processing time.

            
            q)\s
            8i
            
            /Before: kdb+ 4.0
            q)\t (inv peach)peach 2 4 1000 1000#8000000?1.
            4406
            
            /After: kdb+ 4.1
            q)\t (inv peach)peach 2 4 1000 1000#8000000?1.
            2035


            Network Improvements

            For large enterprise deployments and cloud enabled workloads, unlimited network connections offer reliability and robust performance at an unprecedented scale. With kdb+ 4.1, user-defined shared libraries now extend well beyond 1024 file descriptors for event callbacks, and HTTP Persistent Connections elevate efficiency and responsiveness of data interactions, replacing the one-and-done approach previously used to reduce latency and optimize resource utilization.

            Multithreaded Data Loading

            The CSV load, fixed-width load (0:), and binary load (1:) functionalities are now multithreaded, signifying a significant leap in performance and efficiency, this is particularly beneficial for handling large datasets which in our own tests have resulted in a 50% reduction in ingestion times.

            Socket Performance

            Socket operations have also been enhanced, resulting in a five-fold increase in throughput when tested against previous versions. With kdb+ 4.1 users can expect a significant boost in overall performance and a tangible difference, when dealing with high volume connections.

            
            q)h:hopen `:tcps://localhost:9999
            q)h ".z.w"
            1004i
            
            /Before: kdb+ 4.0
            q)\ts:10000 h "2+2"
            1508 512
            
            /After: kdb+ 4.1
            q)\ts:10000 h "2+2"
            285 512


            Enhanced TLS Support and Updated OpenSSL

            Enhanced TLS and Updated OpenSSL Support guarantee compliance and safeguard sensitive real-time data exchanges. With kdb 4.1 OpenSSL 1.0, 1.1.x, and 3.x, coupled with dynamic searching for OpenSSL libraries and TCP and UDS encryption, offers a robust solution for industries where data integrity and confidentiality are non-negotiable.

            Furthermore, TLS messaging can now be utilized on threads other than the main thread. This allows for secure Inter-Process Communication (IPC) and HTTP operations in multithreaded input queue mode. Additionally, HTTP client requests and one-shot sync messages within secondary threads are facilitated through “peach”.

            More Algorithms for At-Rest Compression

            With the incorporation of advanced compression algorithms, kdb+ 4.1 ensures maximized storage efficiency without compromising data access speed. This provides a strategic advantage when handling extensive datasets.

            New q Language Features

            Kdb+ 4.1 introduces several improvements to the q language that will help to streamline your code.

            1. Dictionary Literal Syntax
              With dictionary literals, you can concisely define dictionaries. For instance, for single element dictionaries you no longer need to enlist. Compare


              q)enlist[`aaa]!enlist 123 / 4.0
              aaa| 123


              With


              q)([aaa:123]) / 4.1
              aaa| 123


              This syntax follows rules consistent with list and table literal syntax.


              q)([0;1;2]) / implicit key names assigned when none defined
              x | 0
              x1| 1
              x2| 2
              
              q)d:([a:101;b:]);d 102 / missing values create projections
              a| 101
              b| 102
              
              q)d each`AA`BB`CC
              a b
              ------
              101 AA
              101 BB
              101 CC


            2. Pattern Matching
              Assignment has been extended so the left-hand side of the colon (:) can now be a pattern.


              /Traditional Method
              q)a:1 / atom
              
              /Using new method to assign b as 2 and c as 3
              q)(b;c):(2;3) / list
              
              /Pattern matching on dictionary keys
              q)([four:d]):`one`two`three`four`five!1 2 3 4 5 / dictionary
              
              /Assigning e to be the third column x2
              q)([]x2:e):([]1 2;3 4;5 6) / table
              
              q)a,b,c,d,e
              1 2 3 4 5 6


              Before assigning any variables, q will ensure left and right values match.


              q)(1b;;x):(1b;`anything;1 2 3) / empty patterns match anything
              q)x
              
              1 2 3


              Failure to match will throw an error without assigning.

              
              q)(1b;y):(0b;3 2 1)
              'match
              
              q)y
              'y


            3. Type checking
              While we’re checking patterns, we could also check types.


              /Checks if surname is a symbol
              q)(surname:`s):`simpson
              
              /Checks if age is a short
              q)(name:`s;age:`h):(`homer;38h)
              
              /Type error triggered as float <> short
              q)(name:`s;age:`h):(`marge;36.5) / d'oh
              'type
              
              q)name,surname / woohoo!
              `homer`simpson


              And check function parameters too.


              q)fluxCapacitor:{[(src:`j;dst:`j);speed:`f]$[speed<88;src;dst]}
              
              q)fluxCapacitor[1955 1985]87.9
              1955
              
              q)fluxCapacitor[1955 1985]88
              'type
              
              q)fluxCapacitor[1955 1985]88.1 / Great Scott!
              1985


            4. Filter functions

              We can extend this basic type checking to define our own ‘filter functions’ to run before assignment.


              / return the value (once we're happy)
              
              q)tempCheck:{$[x<0;' "too cold";x>40;'"too hot" ;x]}
              q)c2f:{[x:tempCheck]32+1.8*x}
              q)c2f -4.5
              'too cold
              
              q)c2f 42.8
              'too hot
              
              q)c2f 20 / just right
              68f


              We can use filter functions to change the values that we’re assigning.


              q)(a;b:10+;c:100+):1 2 3
              q)a,b,c
              1 12 103


              Amend values at depth without assignment.


              q)addv:{([v:(;:x+;:(x*10)+)]):y}
              q)addv[10;([k:`hello;v:1 2 3])]
              k| `hello
              v| 1 12 103


              Or even change the types.


              q)chkVals:{$[any null x:"J"$ "," vs x;'`badData;x]}
              q)sumVals:{[x:chkVals]sum x}
              q)sumVals "1,1,2,3,5,8"
              20
              
              q)sumVals "8,4,2,1,0.5"
              'badData


            Happy Coding

            We hope you are as excited as we are about the possibilities these enhancements bring to your development toolkit. From parallel processing and network scalability to streamlined data loading, secure transmissions, and optimized storage, our commitment is to empower you with tools that make your coding life more efficient and enjoyable.

            We invite you to dive in, explore, and unlock the full potential of kdb+ 4.1. Download our free Personal Edition today.

            Happy coding!

            Related Resources

            投稿が見つかりませんでした。

            11 Insights to Help Quants Break Through Data and Analytics Barriers

            デモを予約する

            The Montauk Diaries – Two Stars Collide

            by Steve Wilcockson


            Two Stars Collide: Thursday at KX CON [23]


            My favorite line that drew audible gasps at the opening day at the packed KX CON [23]

            “I don’t work in q, but beautiful beautiful Python” said Erin Stanton of Virtu Financial simply and eloquently. As the q devotees in the audience chuckled, she qualified her statement further “I’m a data scientist. I love Python.”

            The q devotees had their moments later however when Pierre Kovalev of the KX Core Team Developer didn’t show Powerpoint, but 14 rounds of q, interactively swapping characters in his code on the fly to demonstrate key language concepts. The audience lapped up the q show, it was brilliant.

            Before I return to how Python and kdb/q stars collide, I’ll note the many announcements during the day, which are covered elsewhere and to which I may return in a later blog. They include:

            Also, Kevin Webster of Columbia University and Imperial College highlighted the critical role of kdb in price impact work. He referenced many of my favorite price impact academics, many hailing from the great Capital Fund Management (CFM).

            Yet the compelling theme throughout Thursday at KX CON [23] was the remarkable blend of the dedicated, hyper-efficient kdb/q and data science creativity offered up by Python.

            Erin’s Story

            For me, Erin Stanton’s story was absolutely compelling. Her team at broker Virtu Financial had converted a few years back what seemed to be largely static, formulaic SQL applications into meaningful research applications. The new generation of apps was built with Python, kdb behind the scenes serving up clean, consistent data efficiently and quickly.

            “For me as a data scientist, a Python app was like Xmas morning. But the secret sauce was kdb underneath. I want clean data for my Python, and I did not have that problem any more. One example, I had a SQL report that took 8 hours. It takes 5 minutes in Python and kdb.”

            The Virtu story shows Python/kdb interoperability. Python allows them to express analytics, most notably machine learning models (random forests had more mentions in 30 minutes than I’ve heard in a year working at KX, which was an utter delight! I’ve missed them). Her team could apply their models to data sets amounting to 75k orders a day, in one case 6 million orders over a 4 months data period, an unusual time horizon but one which covered differing market volatilities for training and key feature extraction. They could specify different, shorter time horizons, apply different decision metrics. ”I never have problems pulling the data.” The result: feature engineering for machine learning models that drives better prediction and greater client value. With this, Virtu Financial have been able to “provide machine learning as a service to the buyside… We give them a feature engineering model set relevant to their situation!,” driven by Python, data served up by kdb.

            The Highest Frequency Hedge Fund Story

            I won’t name the second speaker, but let’s just say they’re leaders on the high-tech algorithmic buy-side. They want Python to exhibit q-level performance. That way, their technical teams can use Python-grade utilities that can deliver real-time event processing and a wealth of analytics. For them, 80 to 100 nodes could process a breathtaking trillion+ events per day, serviced by a sizeable set of Python-led computational engines.

            Overcoming the perceived hurdle of expressive yet challenging q at the hedge fund, PyKX bridges Python to the power of kdb/q. Their traders, quant researchers and software engineers could embed kdb+ capabilities to deliver very acceptable performance for the majority of their (interconnected, graph-node implemented) Python-led use cases. With no need for C++ plug-ins, Python controls the program flow. Behind-the-scenes, the process of conversion between NumPy, pandas, arrow and kdb objects is abstracted away.

            This is a really powerful use case from a leader in its field, showing how kdb can be embedded directly into Python applications for real-time, ultra-fast analytics and processing.

            Alex’s Story

            Alex Donohoe of TD Securities took another angle for his exploration of Python & kdb. For one thing, he worked with over-the-counter products (FX and fixed income primarily) which meant “very dirty data compared to equities.” However, the primary impact was to explore how Python and kdb could drive successful collaboration across his teams, from data scientists and engineers to domain experts, sales teams and IT teams.

            Alex’s personal story was fascinating. As a physics graduate, he’d reluctantly picked up kdb in a former life, “can’t I just take this data and stick it somewhere else, e.g., MATLAB?”

            He stuck with kdb.

            “I grew to love it, the cleanliness of the [q] language,” “very elegant for joins” On joining TD, he was forced to go without and worked with Pandas, but he built his ecosystem in such a way that he could integrate with kdb at a later date, which he and his team indeed did. His journey therefore had gone from “not really liking kdb very much at all to really enjoying it, to missing it”, appreciating its ability to handle difficult maths efficiently, for example “you  do need a lot of compute to look at flow toxicity.” He learnt that Python could offer interesting signals out of the box including non high-frequency signals, was great for plumbing, yet kdb remained unsurpassed for its number crunching.

            Having finally introduced kdb to TD, he’s careful to promote it well and wisely. “I want more kdb so I choose to reduce the barriers to entry.” His teams mostly start with Python, but they move into kdb as the problems hit the kdb sweet spot.

            On his kdb and Python journey, he noted some interesting, perhaps surprising, findings. “Python data explorers are not good. I can’t see timestamps. I have to copy & paste to Excel, painfully. Frictions add up quickly.”  He felt “kdb data inspection was much better.” From a Java perspective too, he looks forward to mimicking the developmental capabilities of Java when able to use kdb in VS Code.”

            Overall, he loved that data engineers, quants and electronic traders could leverage Python, but draw on his kdb developers to further support them. Downstream risk, compliance and sales teams could also more easily derive meaningful insights more quickly, particularly important as they became more data aware wanting to serve themselves.

            Thursday at KX CON [23]

            The first day of KX CON [23] was brilliant. a great swathe of great announcements, and superb presentations. For me, the highlight was the different stories of how when Python and kdb stars align, magic happens, while the q devotees saw some brilliant q code.

            Stifel Financial Corp leverages kdb+ for Enhanced Trading Analytics

            kdb+ Personal Edition Download

            kdb+ Personal Edition License Download Confirmation

            Machine Learning Toolkit Update: Cross-Validation and ML Workflow in kdb+

            By Conor McCarthy

            The KX machine learning team has an ongoing project of periodically releasing useful machine learning libraries and notebooks for kdb+. These libraries and notebooks act as a foundation to our users, allowing them to use the ideas presented and the code provided to access the exciting world of machine learning with KX.

            This release, which is the second in a series of releases in 2019, relates to the areas of cross-validation and standardized code distribution procedures for incorporating both Python and q distribution. Such procedures are used in feature creation through the FRESH algorithm and cross-validation within kdb+/q.

            The toolkit is available in its entirety on the KX GitHub with supporting documentation on the Machine Learning Toolkit page of the KX Developers’ site.

            As with all the libraries released from the KX machine learning team, the machine learning Toolkit (ML-Toolkit) and its constituent sections are available as open source, Apache 2 software.

            Background

            The primary purpose of this library is to provide kdb+/q users with access to commonly-used machine learning functions for preprocessing data, extracting features and scoring results.

            This latest release expands on the scoring and feature extraction aspects of the toolkit, by introducing two new areas of functionality and improving functions contained in the machine learning toolkit:

            1. Cross-validation and grid search functions to test the ability of a model to generalize to new or increased volumes of data.
            2. A framework for transparently distributing jobs to worker processes, including serialized Python algorithms.
            3. .ml.df2tab and .ml.tab2df now support time and date types for conversion which improves function performance as incompatible types are no longer returned as foreigns.

            Technical description

            Cross-Validation

            Cross-validation is used to gain a statistical understanding of how well a machine learning model generalizes to independent datasets. This is important in limiting overfitting and selection bias, especially when dealing with small datasets. A variety of methods exist for cross-validation, with the following implemented in this release:

            • Stratified K-Fold Cross-Validation
            • Shuffled K-Fold Cross-Validation
            • Sequentially Split K-Fold Cross-Validation
            • Roll-Forward Time-Series Cross-Validation
            • Chain-Forward Time-Series Cross-Validation
            • Monte-Carlo Cross-Validation

            All of the aforementioned methods have been implemented in kdb+/q and are documented fully on code.kx.com here.  For each of these methods, a grid search procedure has also been implemented allowing users to find the best set of hyperparameters to use with a specific machine learning algorithm.

            The roll-forward and chain-forward methods have particular relevance to time-series data. These methods maintain a strict order where the training sets precede the validation sets, ensuring that future observations are not used in constructing a forecast model. A graphical representation of each is provided below.

            Roll-forward cross-validation

            This method tests the validity of a model over time with equisized training and testing sets, while enforcing that the model only test on future data.

            kdb+ ML Fresh library - KX

            Image 1. Roll-forward validation

            Chain-forward cross-validation

            This method tests the ability of a model to generalize when retrained on increasingly larger volumes of data. It provides insight into how the accuracy of predictions is affected when expanding volumes of training data are used.

            kdb+ FRESH ML library - KX

            Image 2. Chain-forward validation

            Full documentation on the cross-validation functions can be found here.

            Standardized multiprocess distribution framework

            A framework has been developed to transparently distribute jobs to worker processes in kdb+/q. This framework supports distribution of both Python and q code, this has been incorporated into the FRESH and cross-validation libraries and is also available as a standalone library. Distribution works as follows:

            • Initialize a q process with four workers on a user-defined central port.
            $ q ml/ml.q -s -4 -p 1234
            • Load the library ( .ml.loadfile`:util/mproc.q)  into the main process.
            • Call .ml.mproc.init to create and initialize worker processes, e.g. to initialize workers with the FRESH library, call
            .ml.mproc.init[abs system"s"]enlist".ml.loadfile`:fresh/init.q"

            Which results in the following architecture

            kdb+ FRESH ML library, Main Process - KX

            Within the toolkit, work involving both the FRESH and cross-validation procedures will be automatically peached if the console has been started with a defined number of worker processes and main port. The procedures can be initialized by running either of the following:

            FRESH process

            q)\l ml/ml.q            // initialize ml.q on the console
            q).ml.loadfile`:fresh/init.q           // initialize fresh

            Cross-Validation process

            q)\l ml/ml.q            // initialize ml.q on the console
            q).ml.loadfile`:xval/init.q           // initialize cross-validation

            While general purpose in nature, this framework is particularly important when distributing Python.

            The primary difficulty with Python distribution surrounds Python’s use of a Global Interpreter Lock (GIL). This limits the execution of Python bytecode to one thread at a time, thus making distributing Python more complex than its q counterpart. We can subvert this by either wrapping the Python functionality within a q lambda or by converting the Python functionality to a byte stream using Python ‘pickle’ and passing these to the worker processes for execution. Both of these options are possible within the framework outlined here.

            If you would like to further investigate the uses of the machine learning toolkit, check out the machine learning toolkit on the KX GitHub to find the complete list of the functions that are available in the toolkit. You can also use Anaconda to integrate into your Python installation to set up your machine learning environment, or you build your own which consists of downloading kdb+, embedPy and JupyterQ. You can find the installation steps here.

            Please do not hesitate to contact ai@kx.com if you have any suggestions or queries.