We have made changes to our privacy policy.
kdb Products
Overview
KDB.AI
kdb+
kdb Insights
kdb Insights Enterprise
Capabilities
Anomaly Detection
kdb+ Time Series Database
Liquidity Management
PyKX Python Interoperability
The Data Timehouse
Vector Database Explained
Services & Support
Financial Services
Quant Research
Trading Analytics
Industry & IoT
Automotive
Energy & Utilities
Healthcare & Life Sciences
Manufacturing
Telco
Learn
Overview
KX Academy
KX University Partnerships
Connect
KX Community
Community Events
Developer Blog
Build
Download
Documentation
Support
About Us
Partner with Us
KX Partner Network
Find a Partner
Partner Signup
Join Us
Connect with Us
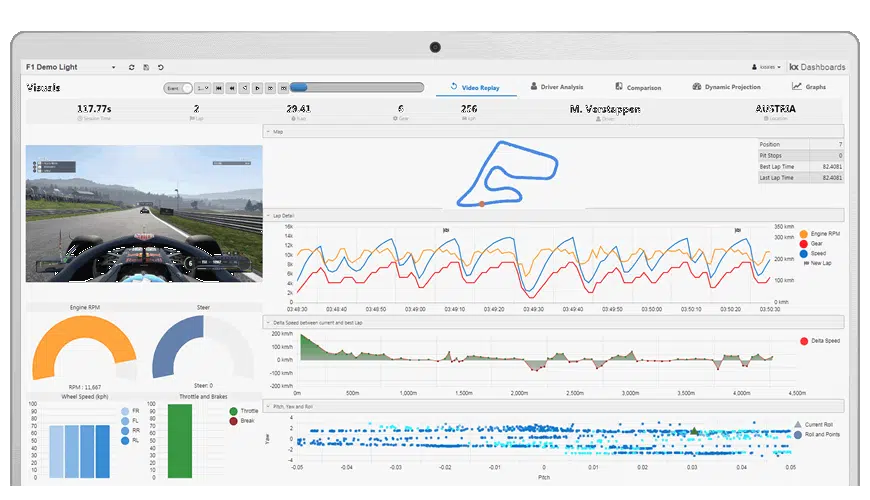
Dashboards bring your data to life with unparalleled low-latency, high-frequency streaming from market feeds, exchanges, sensors, telemetry and other data sources.
View data at optimal speed using hardware acceleration, consolidation, throttling and virtual rendering to deliver high-frequency updates in real time.
A compact binary protocol further minimizes latency and maximizes throughput for optimal performance.
Deliver stunning visuals on a dynamic platform that keeps pace with the latest advances in data science and visualization techniques.
Building dashboards has never been easier – from simple data filters to advanced q analytics that enable you to build complex queries across all your data. Link them all together to create an interactive query graph with the ability to preview results each step of the way.
Real-time OLAP lets you slice-and-dice data, reorder, breakdown and drill into results with simple row clicks. Explore visuals with zoom, pan, drilldown and ad-hoc data filters.
Explore your data in an interactive form which is easy to understand, brings trends and relationships to life, and effectively communicates your insights.
Choose from a wide selection of charts including simple bar and line charts, to candlestick, contour and 3D graphs. Extend with maps, treemaps and network graphs along with other more exotic chart types.
The WYSIWYG interface provides a familiar environment to build interactive dashboards using a drag-and-drop and point-and-click interface.
Adding new or custom components is made easy using standard HTML, Javascript and CSS as Dashboards are built on the Open Web Platform.
In fact, a simple component can be added with just five lines of code – a set of tutorials for the framework-agnostic API shows you how!
Dashboards fit seamlessly into your operating and innovation environment. You can either embed your own components into Dashboards or embed Dashboards themselves into your solutions. Examples of integrations include ChartIQ, MapBox, OpenFin and Finsemble.
AMERICAS
Tel: +1 (212) 447 6700
EMEA
Tel: +44 (0)28 3025 2242
APAC
Tel: +65 65921960
ANZ
Tel: +61 (0)2 9236 5700


